set.seed(1)
norm <- rnorm(100)
hist(x = norm,
     xlab = "X Axis Name",
     ylab = "Count",
     main = "Histogram of 100 observations from a Standard Normal")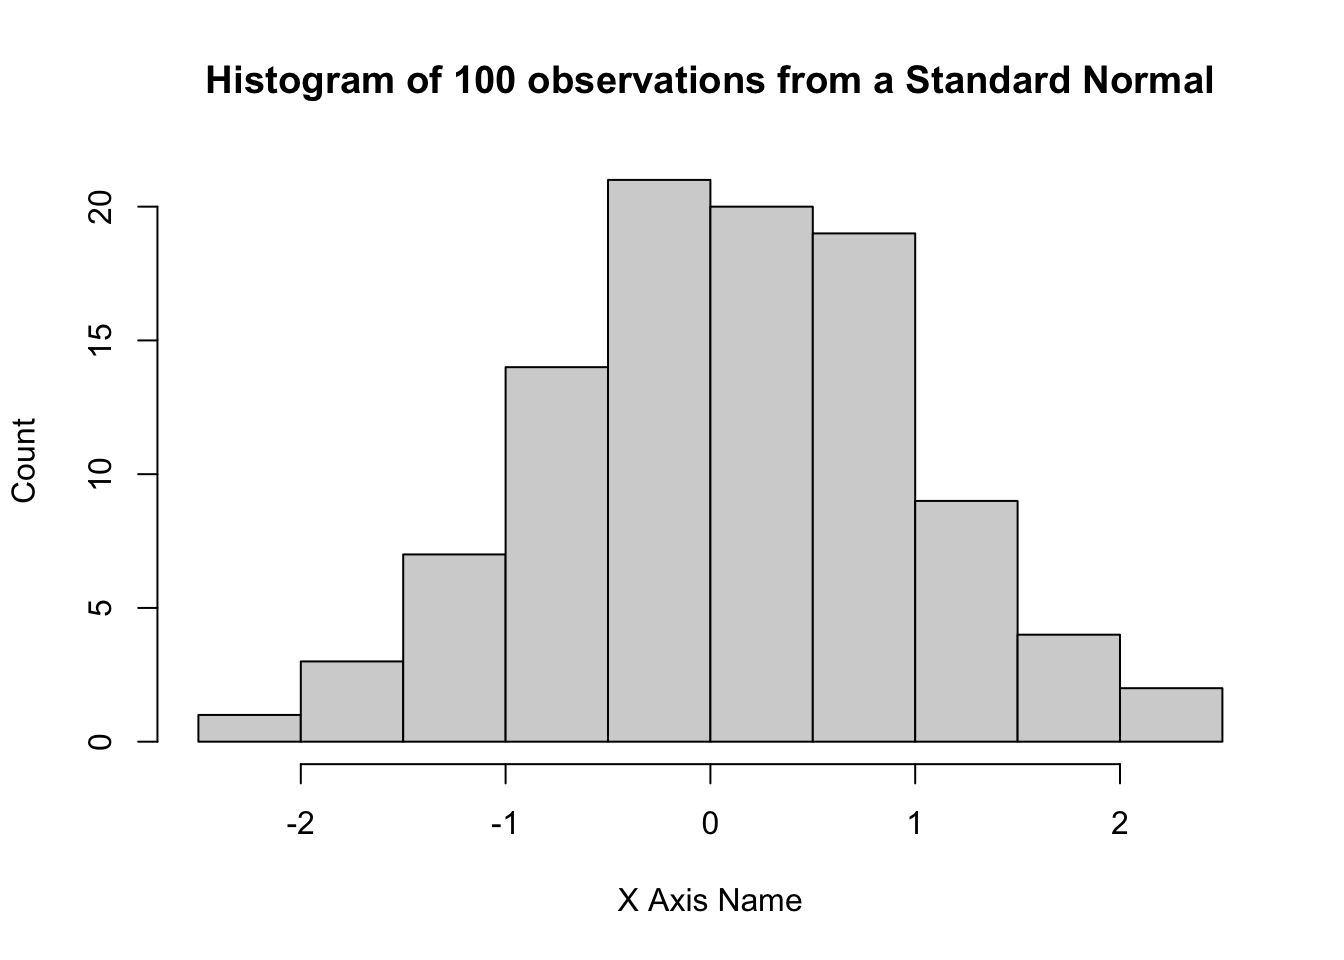
This basic R markdown file has some text, inline code, and code chunks!
set.seed(1)
norm <- rnorm(100)
hist(x = norm,
xlab = "X Axis Name",
ylab = "Count",
main = "Histogram of 100 observations from a Standard Normal")
Unless you include the chunk option #| echo: false, your code chunk will be displayed in your final document.
The sample mean of the data plotted above (rounded to 3 decimal points) is 0.109 and the variance is 0.807.
What’s the relationship between standard deviation and variance?
\[ \text{Standard Deviation}(X) = \sqrt{\text{Variance}(X)} \]
The standard deviation of the data plotted above is 0.898.