| Person # | birth_year | gender | ethnicity | race |
|---|---|---|---|---|
| 1 | 1992 | 1 | 1 | 5 |
| 2 | 1993 | 2 | 0 | 5 |
| 3 | 1995 | 2 | 0 | 2 |
| 4 | 1980 | 2 | 0 | 3 |
| 5 | 1991 | 1 | 1 | 5 |
| 6 | 1975 | 4 | 1 | 1 |
| 7 | 1960 | 1 | 0 | 6 |
| 8 | 1952 | 1 | 0 | 5 |
| 9 | 2000 | 3 | 0 | 3 |
| 10 | 1990 | 1 | 1 | 2 |
| 11 | 1993 | 2 | 1 | 4 |
| 12 | 1992 | 3 | 0 | 4 |
Frequency tables &
Graphical techniques
SOC 221 • Lecture 2
Wednesday, June 25, 2025
Graphical Techniques
Descriptive tools to
display the distribution
of variables, or the
association between
variables, using
pictures or figures.
- Huge topic that people spend their lifetimes perfecting
Today’s goals
- Brief intro to basic types
- Basic guidelines for responsible graphing (given great potential to confuse or mislead)
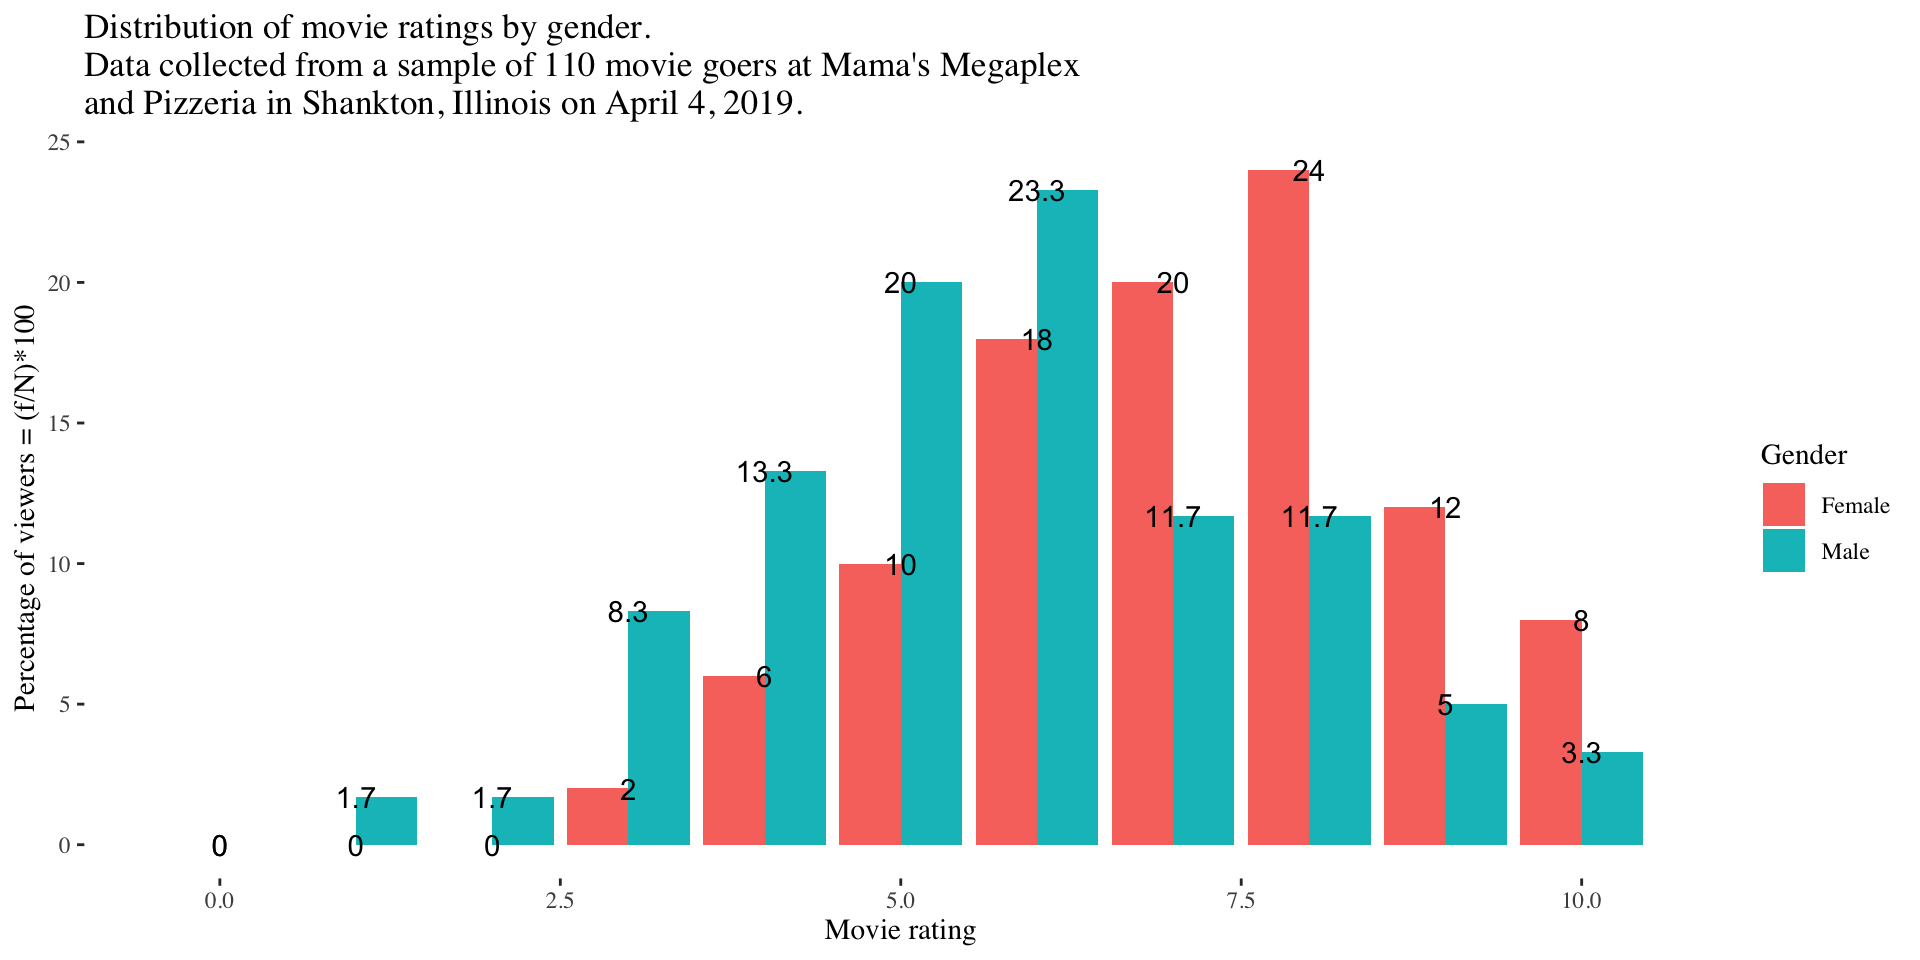
Rule 1: Choose the right kind of graph
Nominal & ordinal variables
Bar chart/graph: % or number of cases in each category
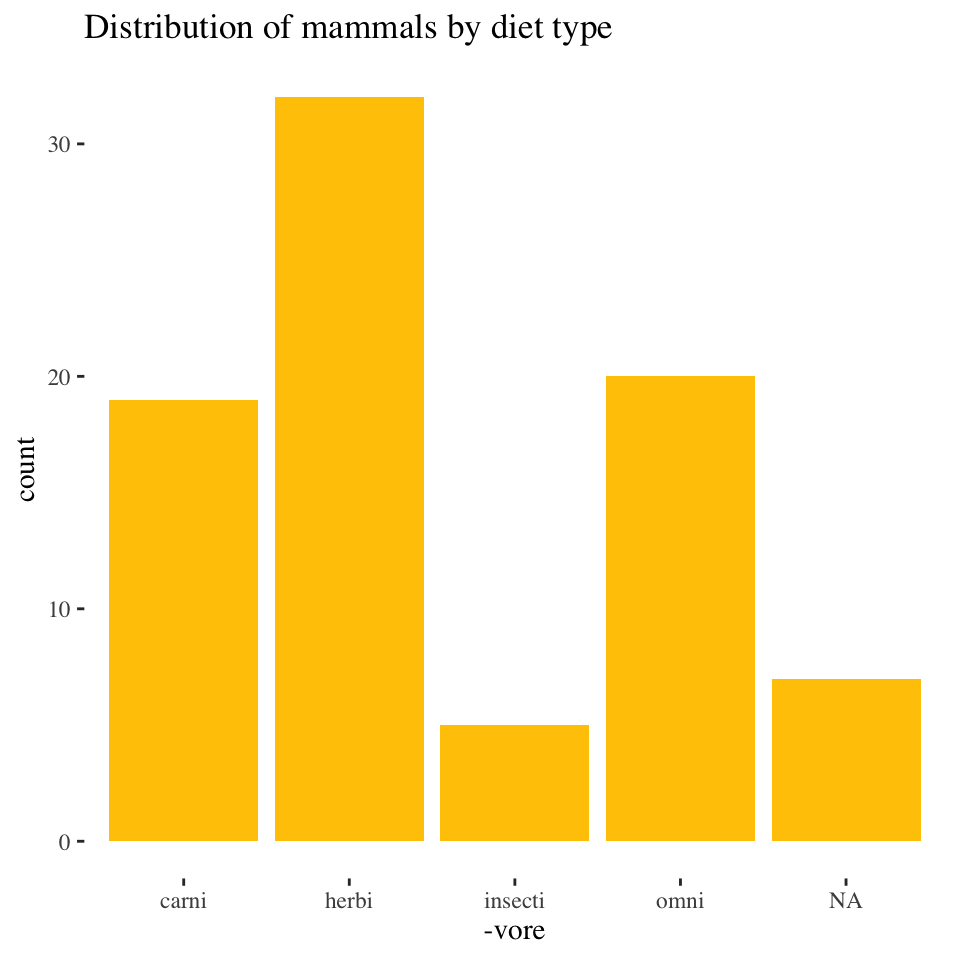
- Summarizes the distribution (relative size of the categories)
- Questions:
- Biggest category?
- Smallest category?
- How much bigger is the biggest category from the 2nd biggest category?
Rule 1: Choose the right kind of graph
Nominal & ordinal variables
Bar chart/graph: % or number of cases in each category
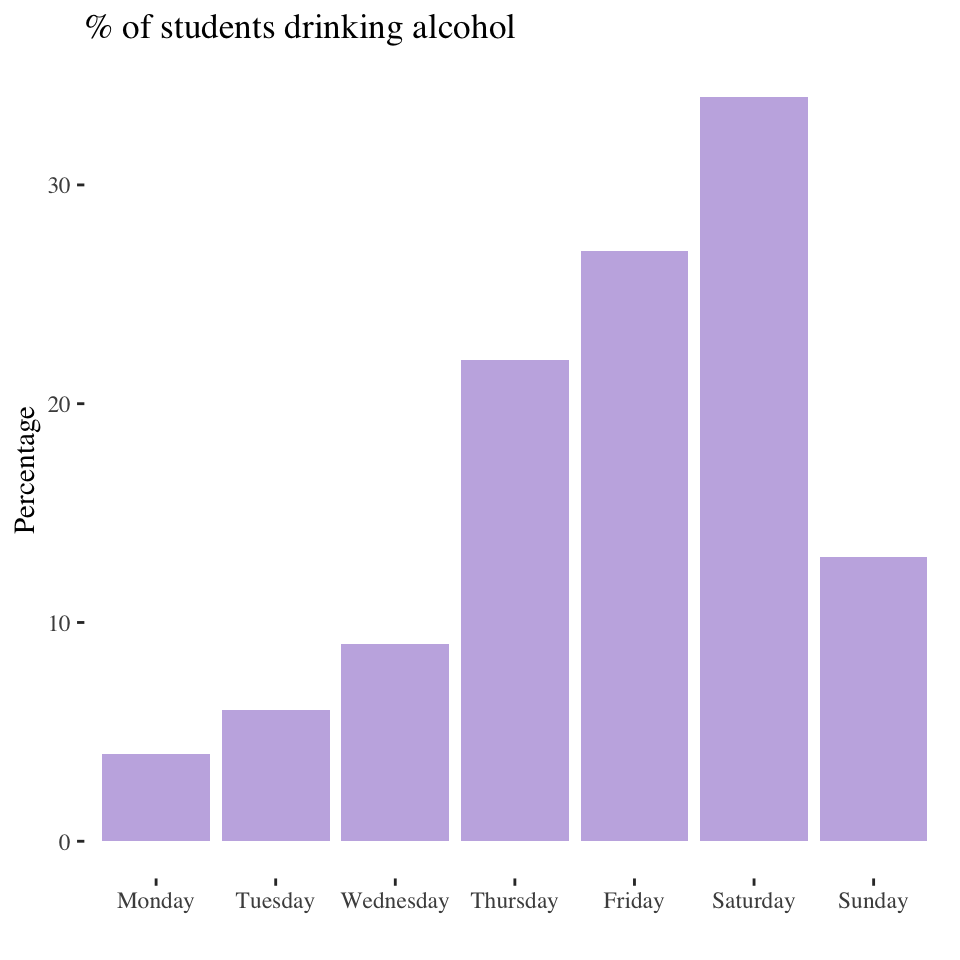
Categories do not necessarily need to add up to 100%
- This chart likely contains responses to several different questions/items.
- Did you drink on Monday?
- Did you drink on Tuesday?
- Etc.
- Level of measurement of the variables produced by these items?
- Nominal
- This type of variable is called a dichotomous (2 values) or dummy (0, 1) variable.
Rule 1: Choose the right kind of graph
Interval variables
Histogram: summarizes the number of cases with each value (or range) on a variable

- Usually used for continuous variables (this is why the bars touch)
- All bars add up to 100% of individuals
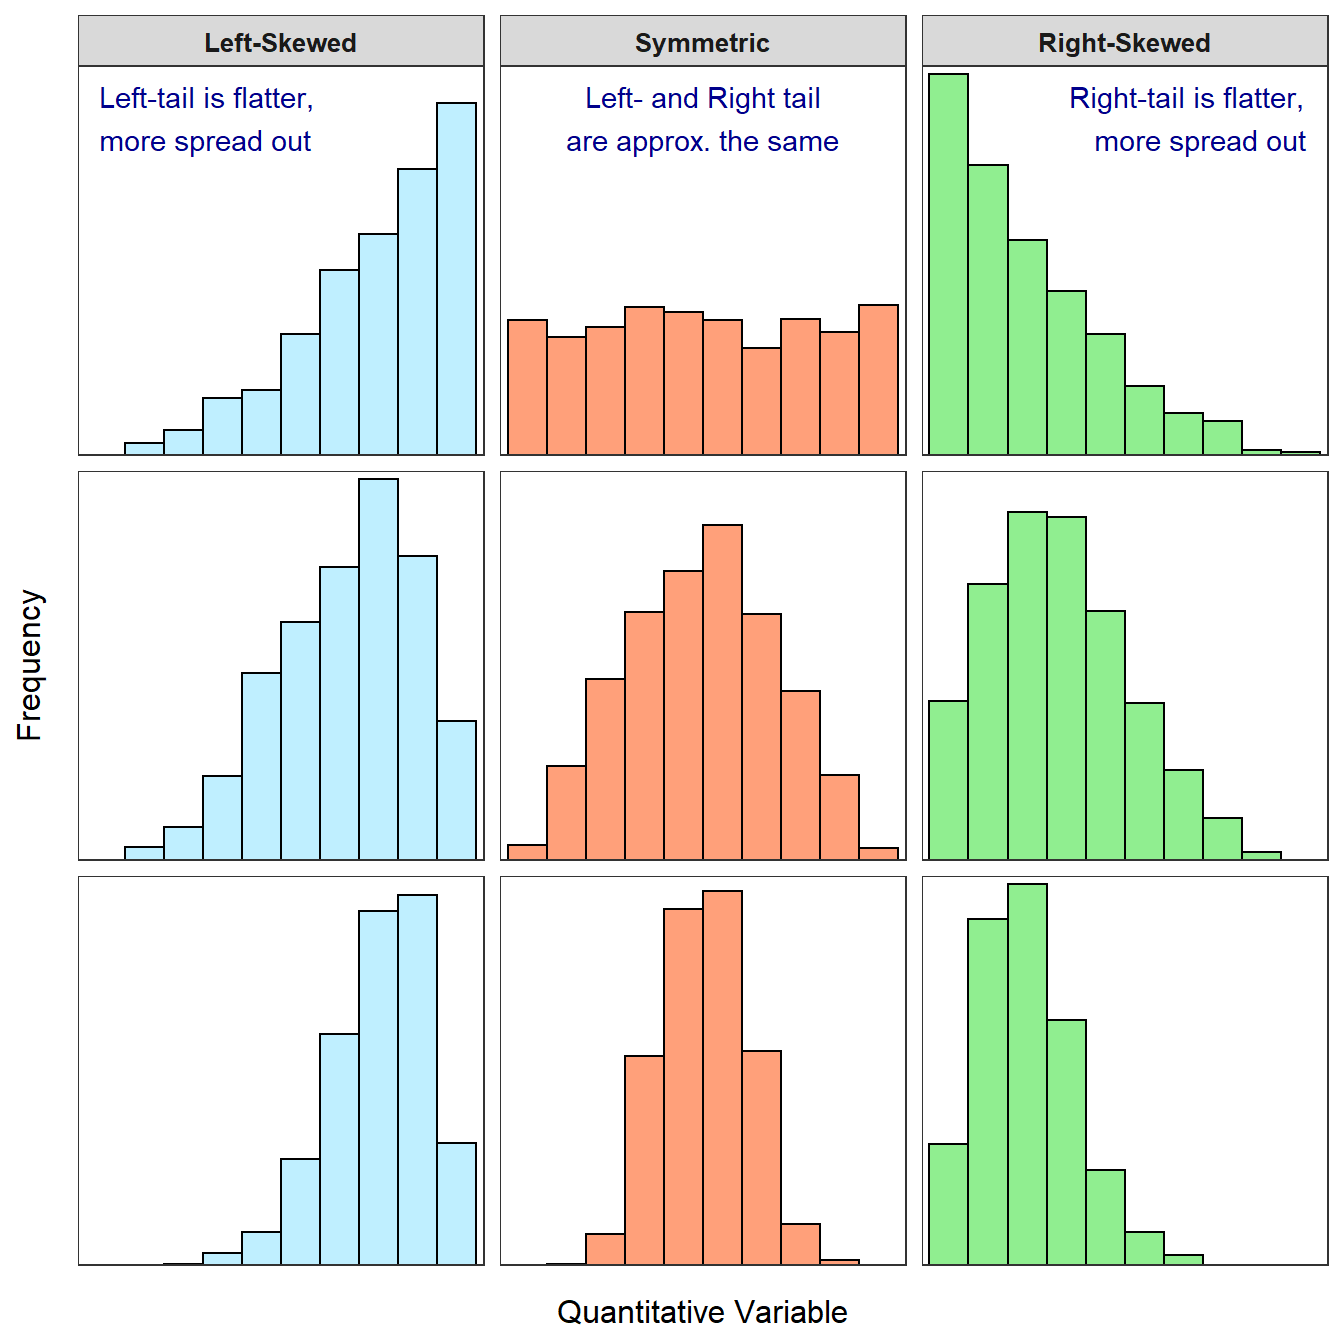
Histograms tell us about the SHAPE of a distribution
- Center:
- Most common value or values
- Where the cases tend to be clustered/centered
- Spread:
- Is there a lot of diversity (cases spread out across the values of the variable)…
- Or are most cases clustered within a few values
- Symmetry vs. Skewness
Rule 1: Choose the right kind of graph
Interval variables
Histogram: summarizes the number of cases with each value (or range) on a variable
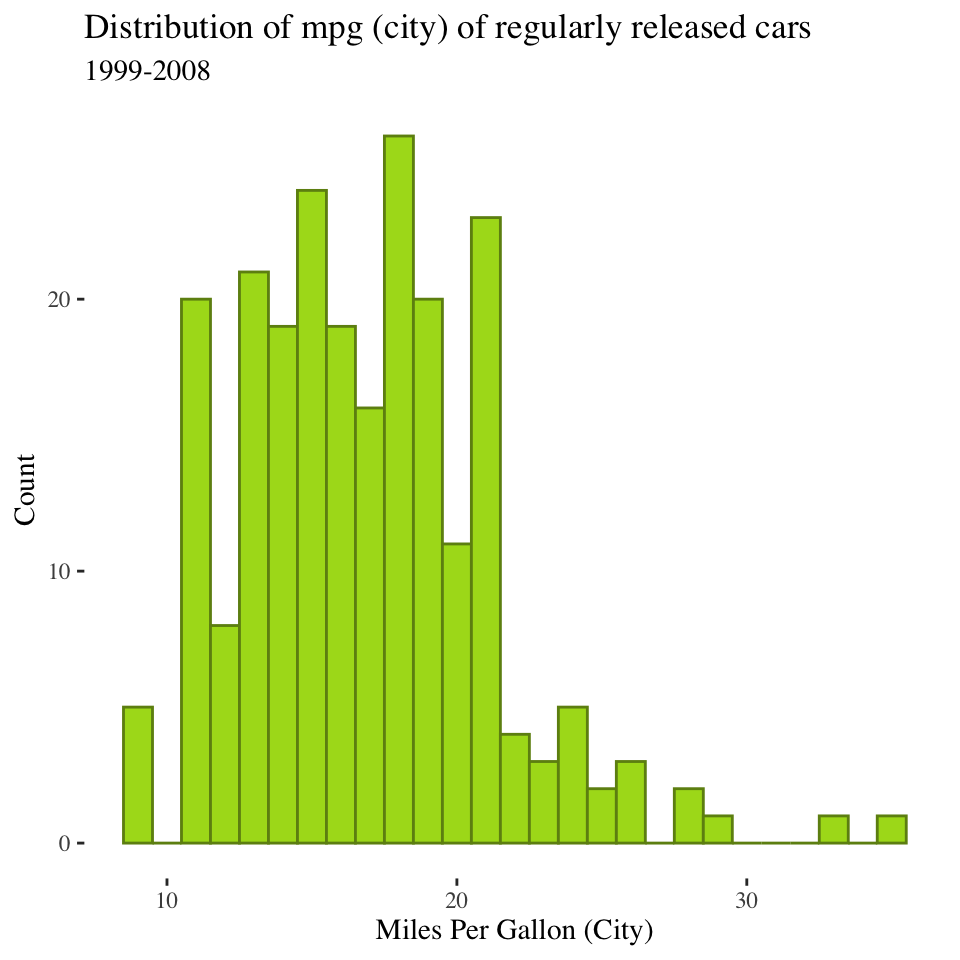
- Usually used for continuous variables (this is why the bars touch)
- All bars add up to 100% of individuals
- What can you say about the shape of this distribution?
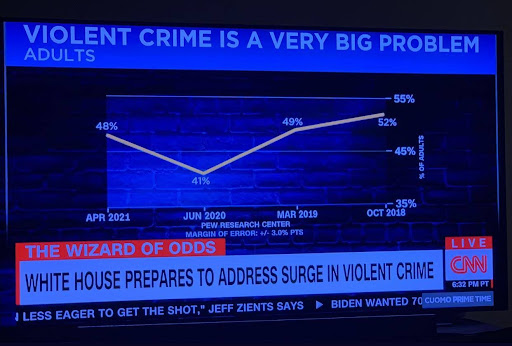
Rule 1: Choose the right kind of graph
Time-series data
Time plots: Shows us trends and discontinuity (unusual periods)
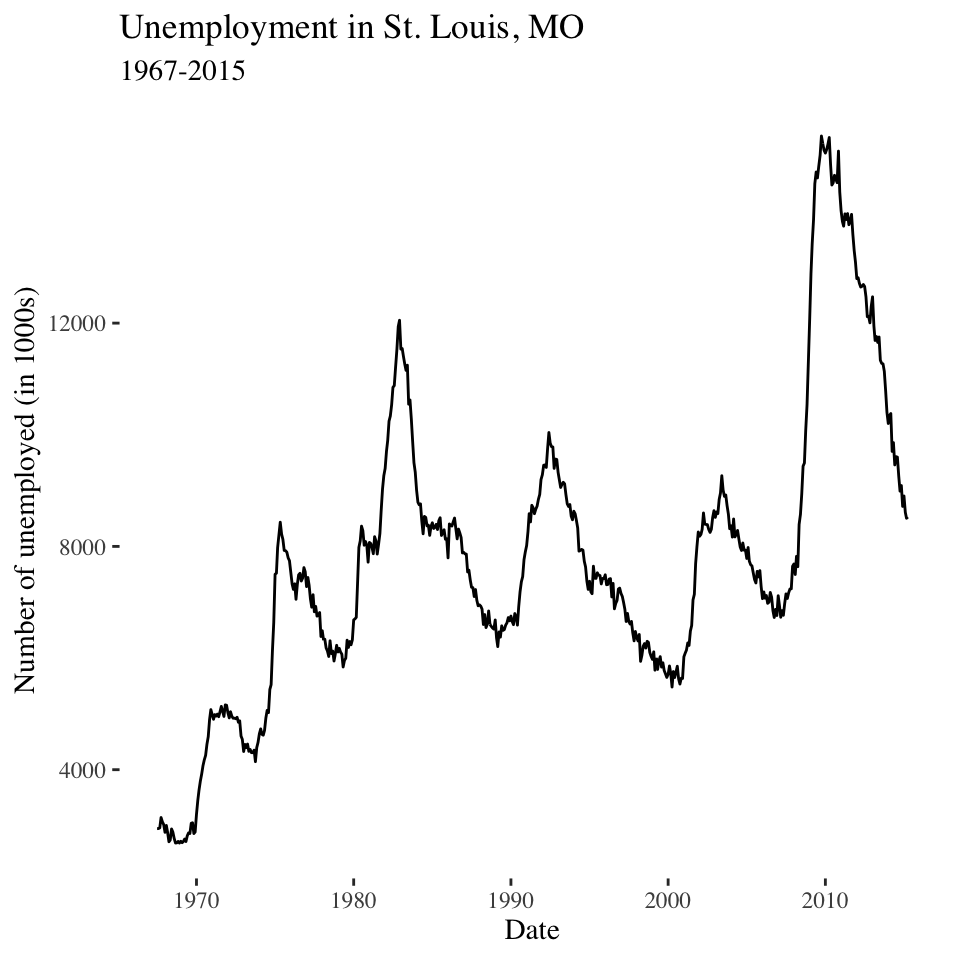
- Time always on the horizontal (x) axis
- Value of the variable always on the vertical (y) axis.
Rule 2: Clearly label the nature of the information
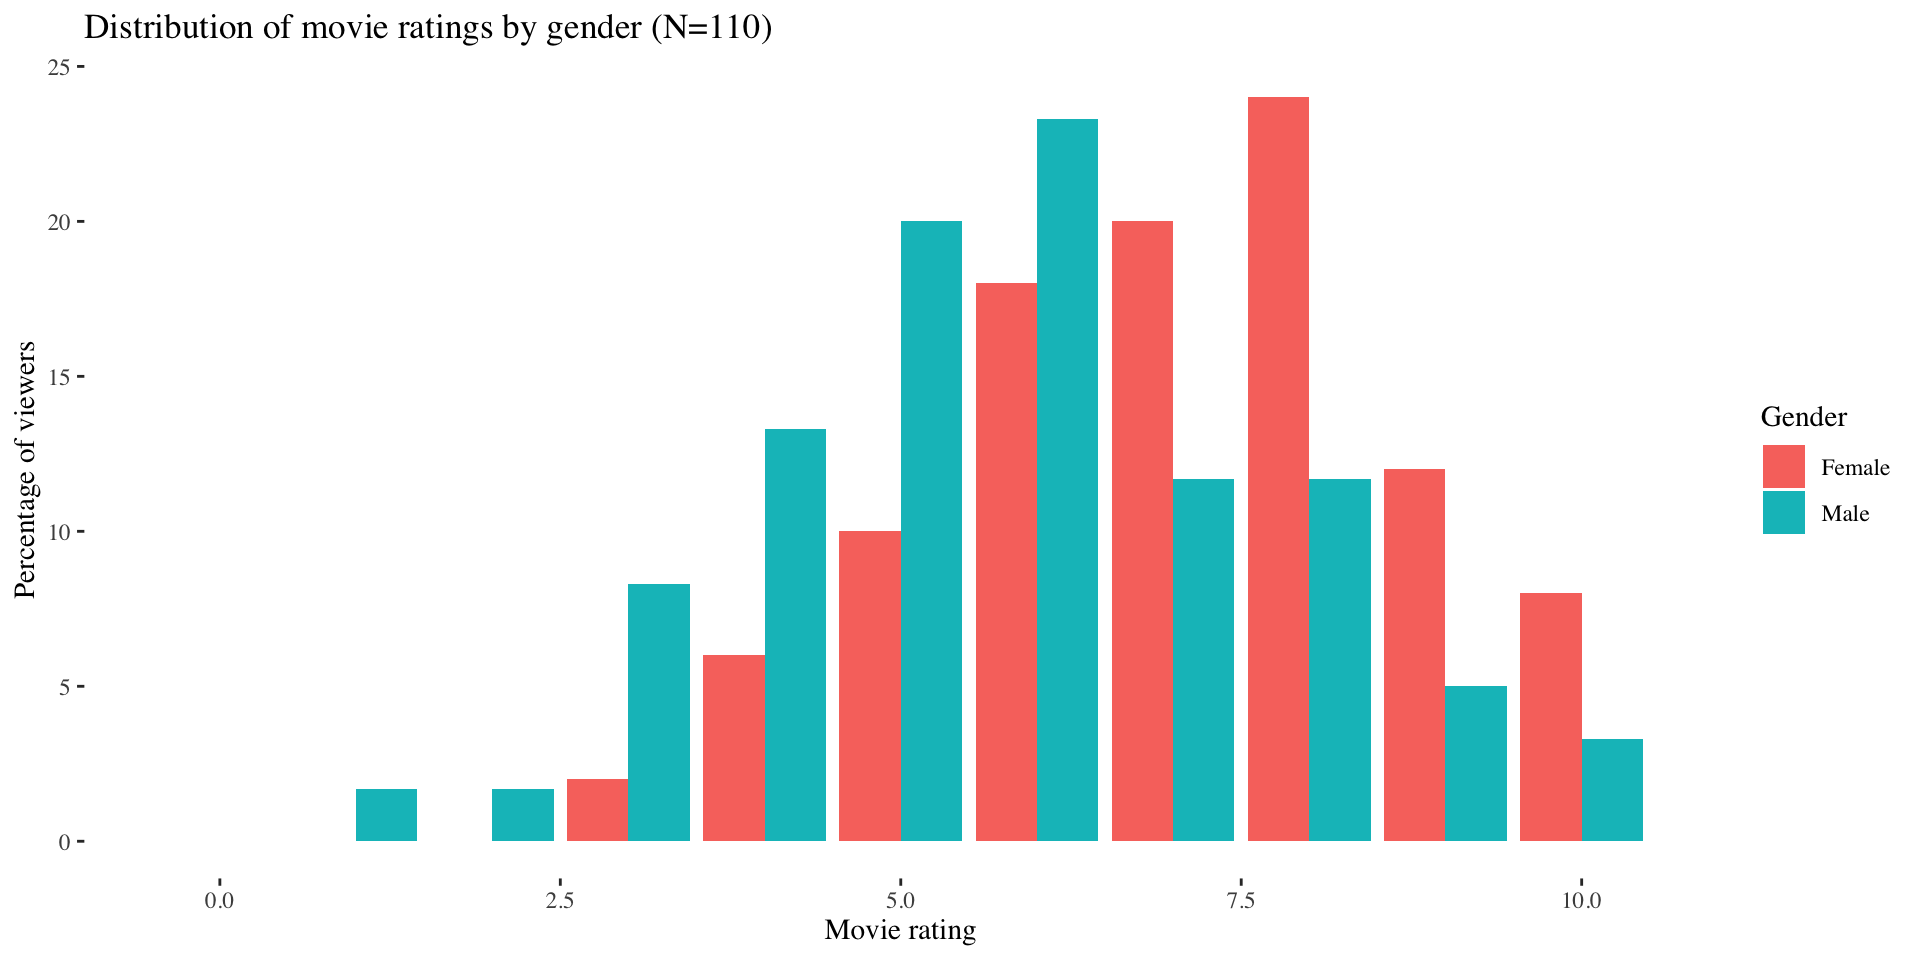
Rule 3: Focus on your perspective
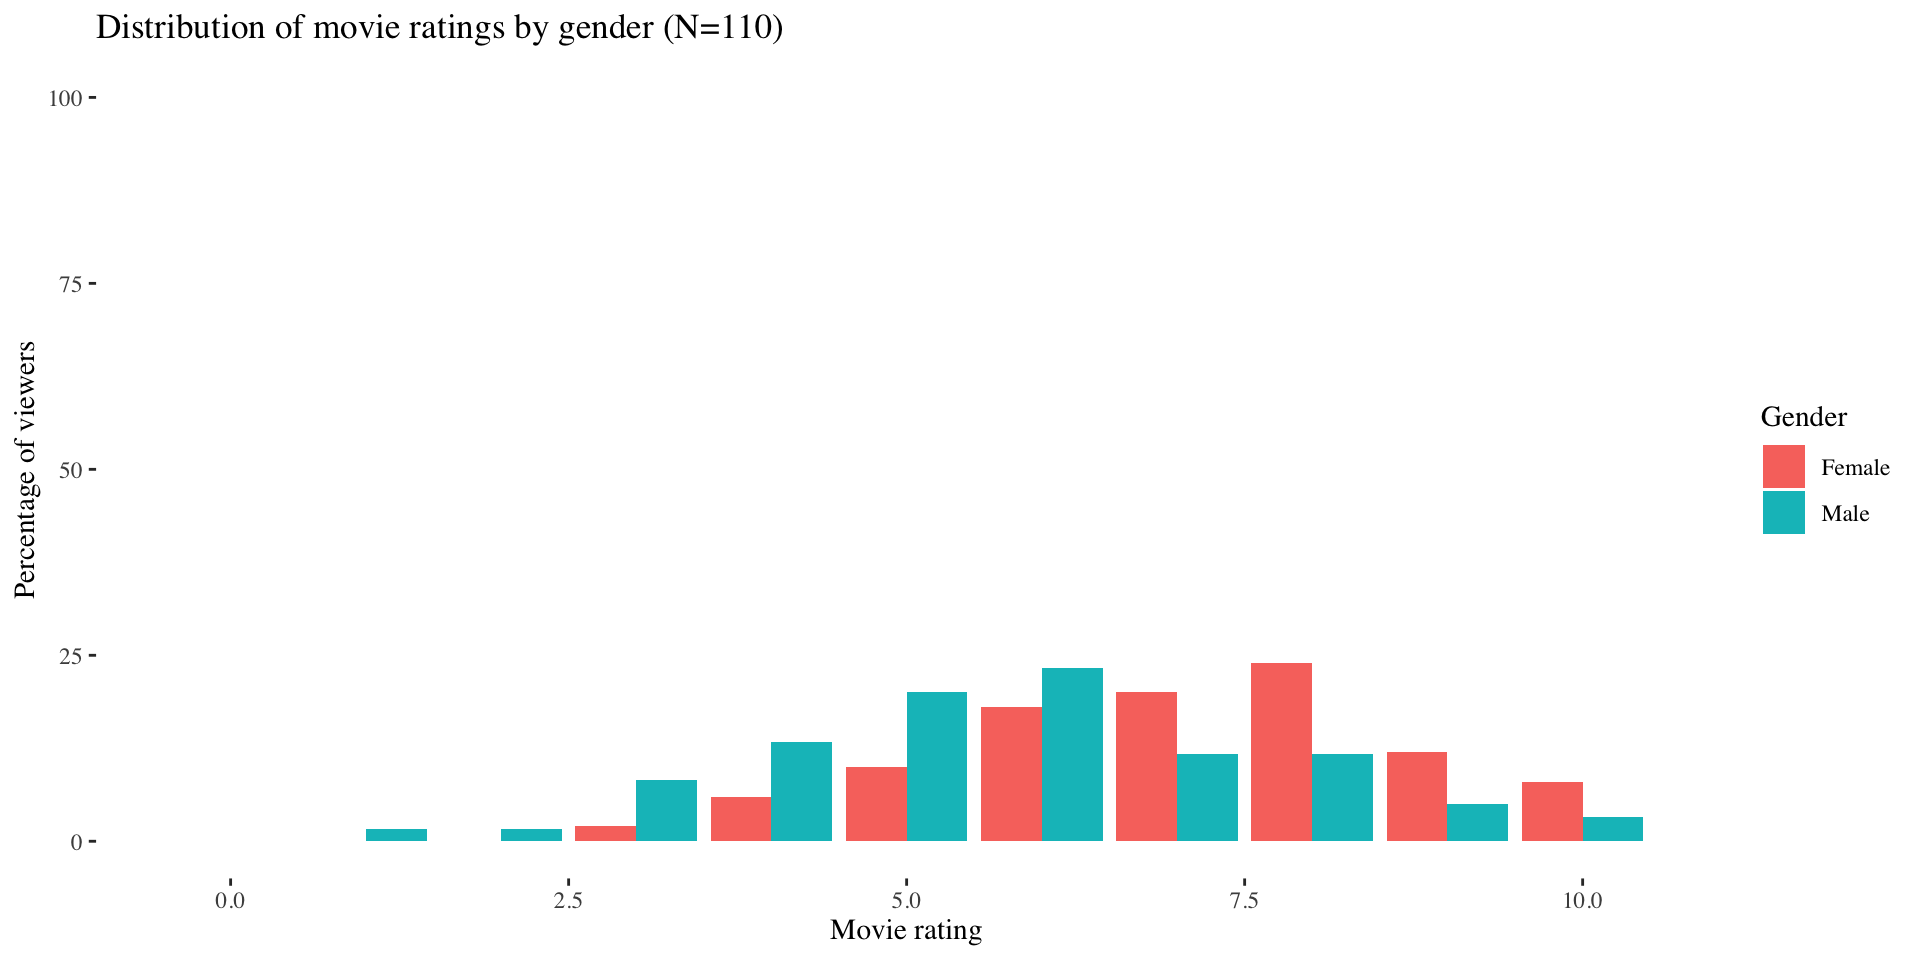
Rule 3: Focus on your perspective

Rule 4: Keep it simple
Rule 5: Be objective
Example of axis truncation
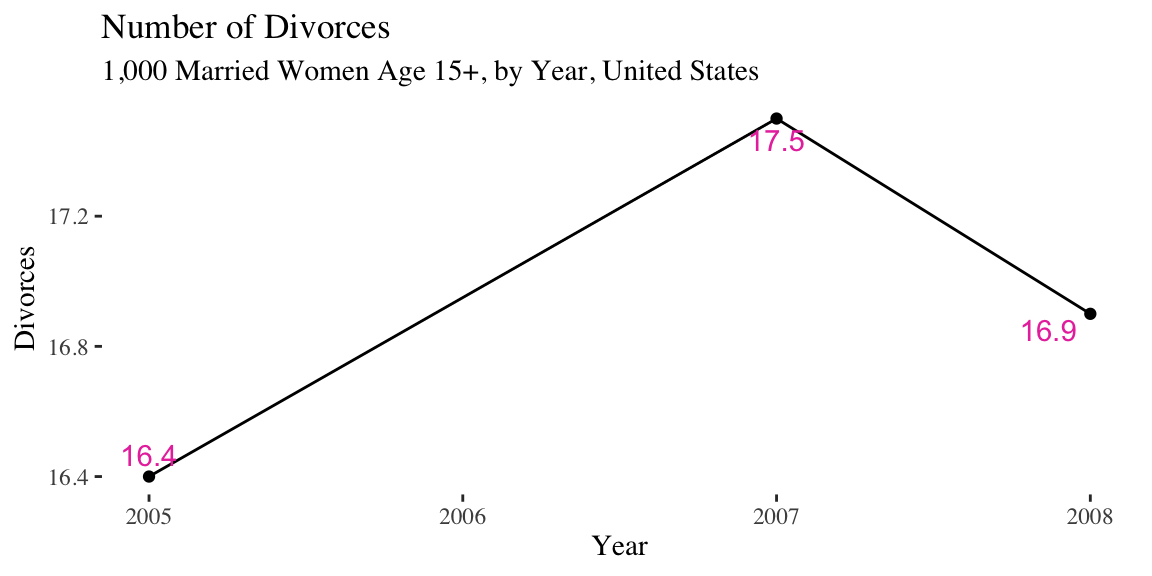
What does this chart imply about divorce rates?
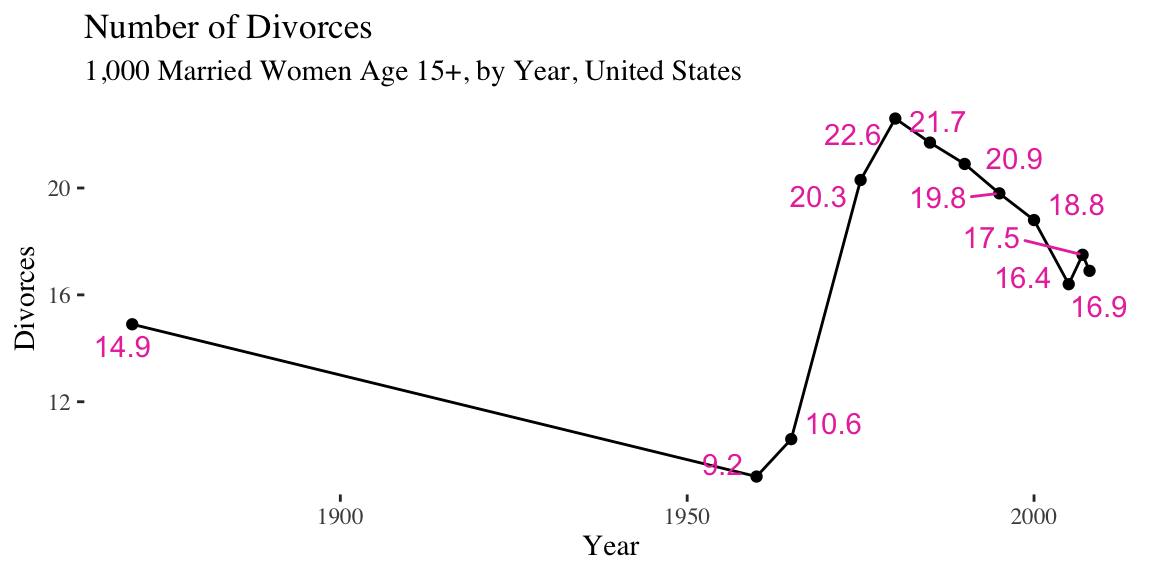
Note the difference in the X and Y axis.
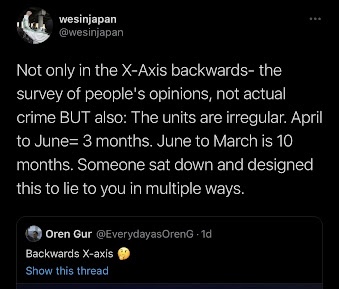
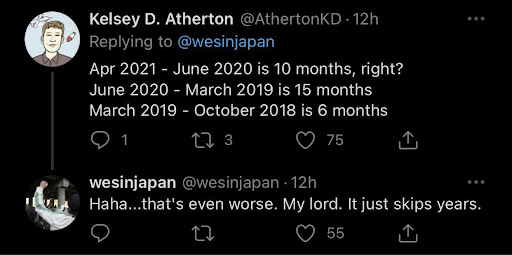
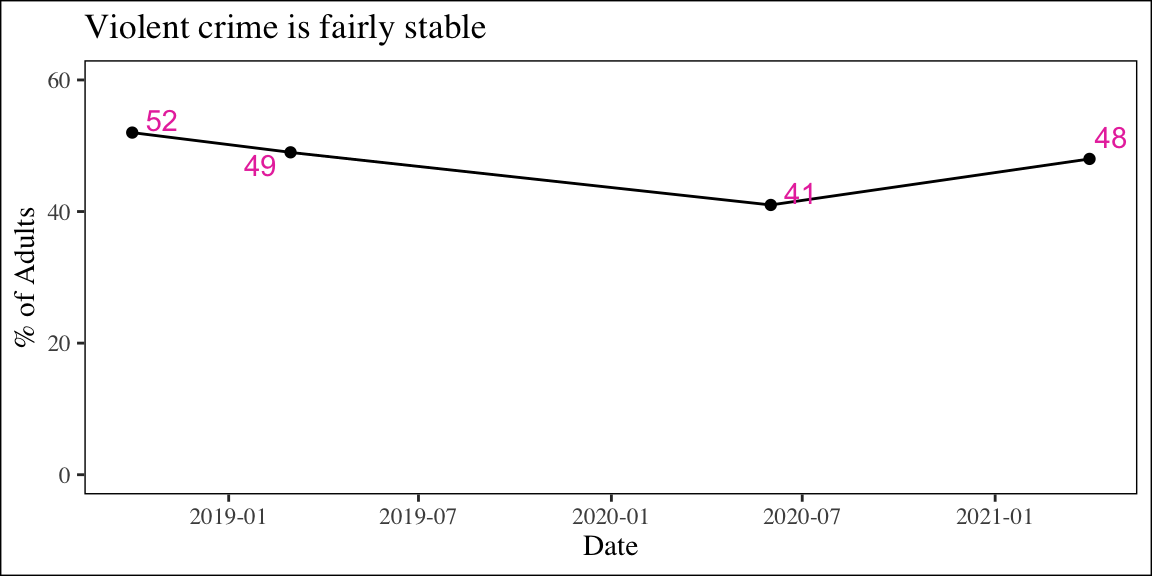
Rule 5: Be objective
No consistent y-axis
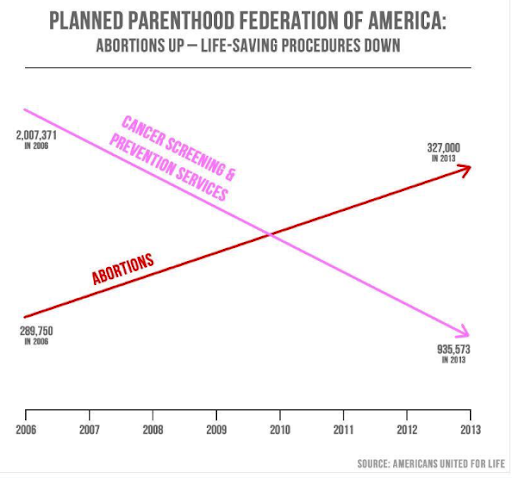
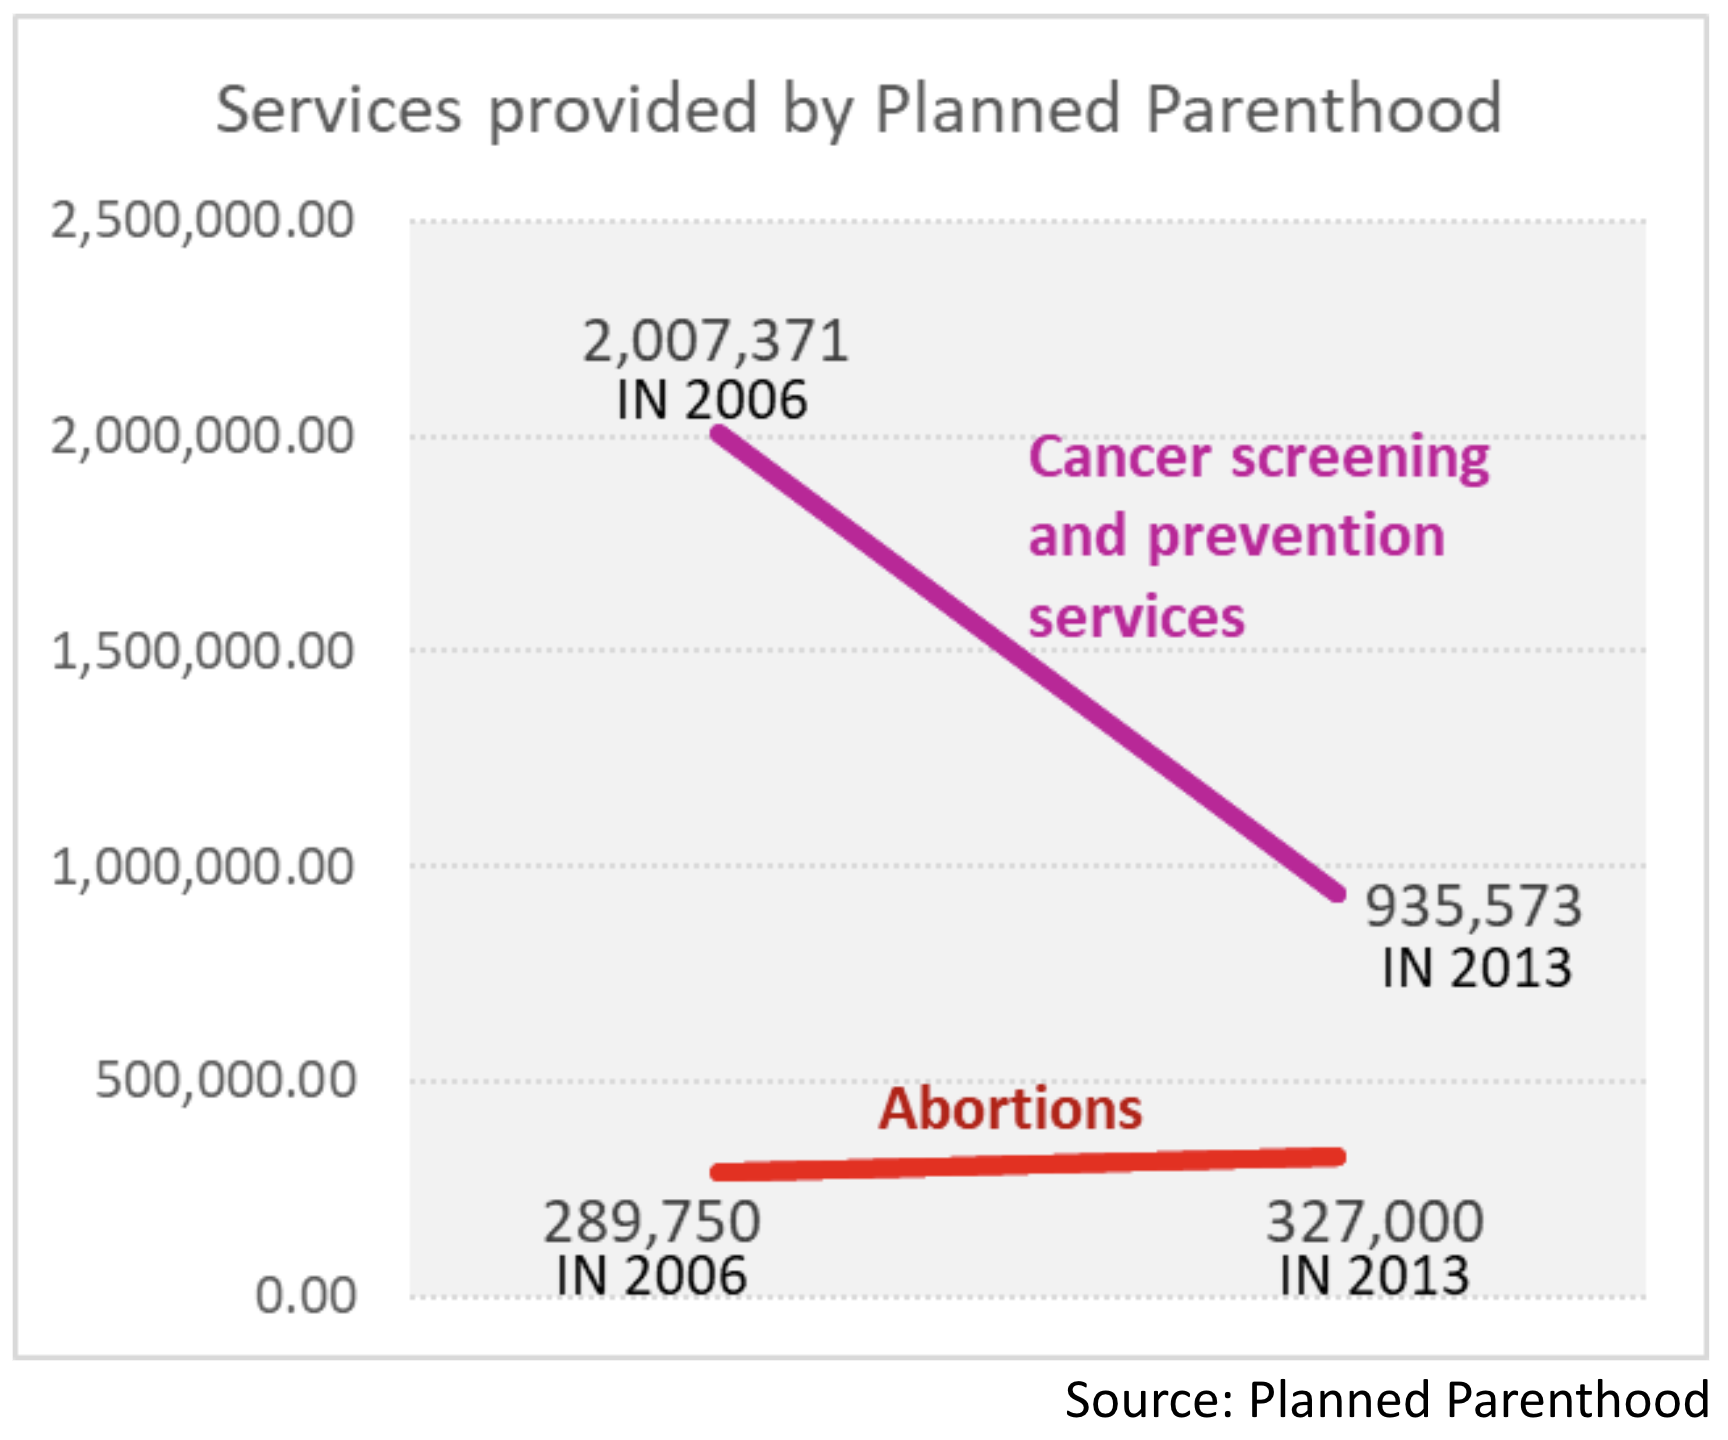
Graphic Presented by Congressman Jason Chaffetz (R-UT) During Meeting About Planned Parenthood Funding. September 29, 2015
Rule 5: Be objective
Purposefully misleading