Introductions,
Overview of statistics, &
Producing data: surveys and sampling
SOC 221 • Lecture 1
Monday, June 23, 2025
Who are you??
Hi! 👋🏻 I’m Vic!
- I’m the instructor for this course and a PhD Candidate in the Sociology department
- I employ statistical methods in my own research on health disparities and the relationship between mental and physical health outcomes
- I use any/all pronouns
- I parent a very sweet & silly pitbull named Margo (aka Marigold)


Who are you??
Hi! 👋🏻 I’m Vic!
- I’m the instructor for this course and a PhD Candidate in the Sociology department
- I employ statistical methods in my own research on health disparities and the relationship between mental and physical health outcomes
- I use any/all pronouns
- I also step-parent an easy-going but goofy golden retriever
named Lemon (aka Clementine)


Some things we know about this class
- Not a class that most students look forward to
- Students sometimes have a lot of anxiety about the course
- Anxiety is often rooted in apprehension about math
Good news!
Statistics is NOT math…
…but it looks a lot like math 😑

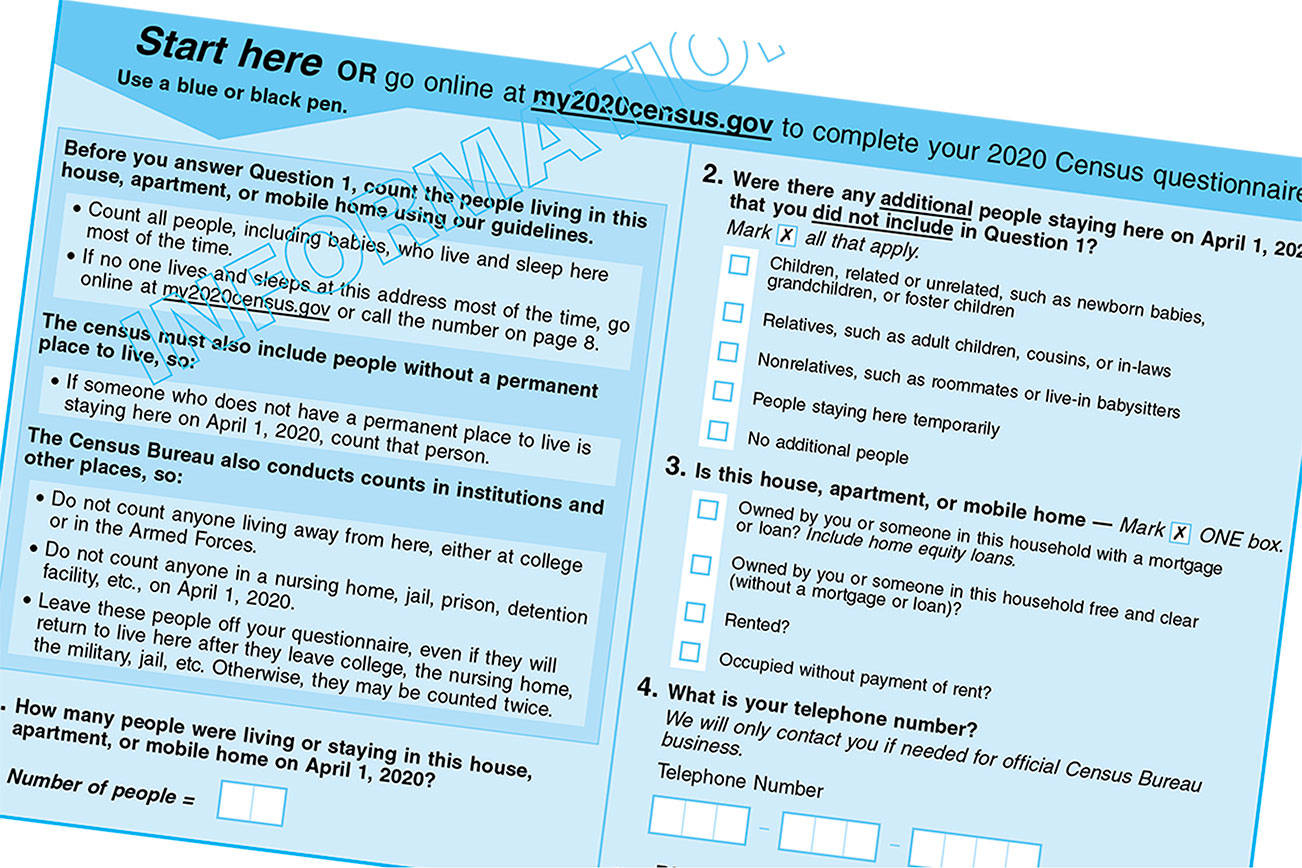
Surveys
Survey
A tool used to ask
people question(s)
in order to gather
information about
what the subject
does, feels,
or thinks.

Levels of Measurement
The level of measurement of a variable refers to the type of information represented in the VALUES of that variable.
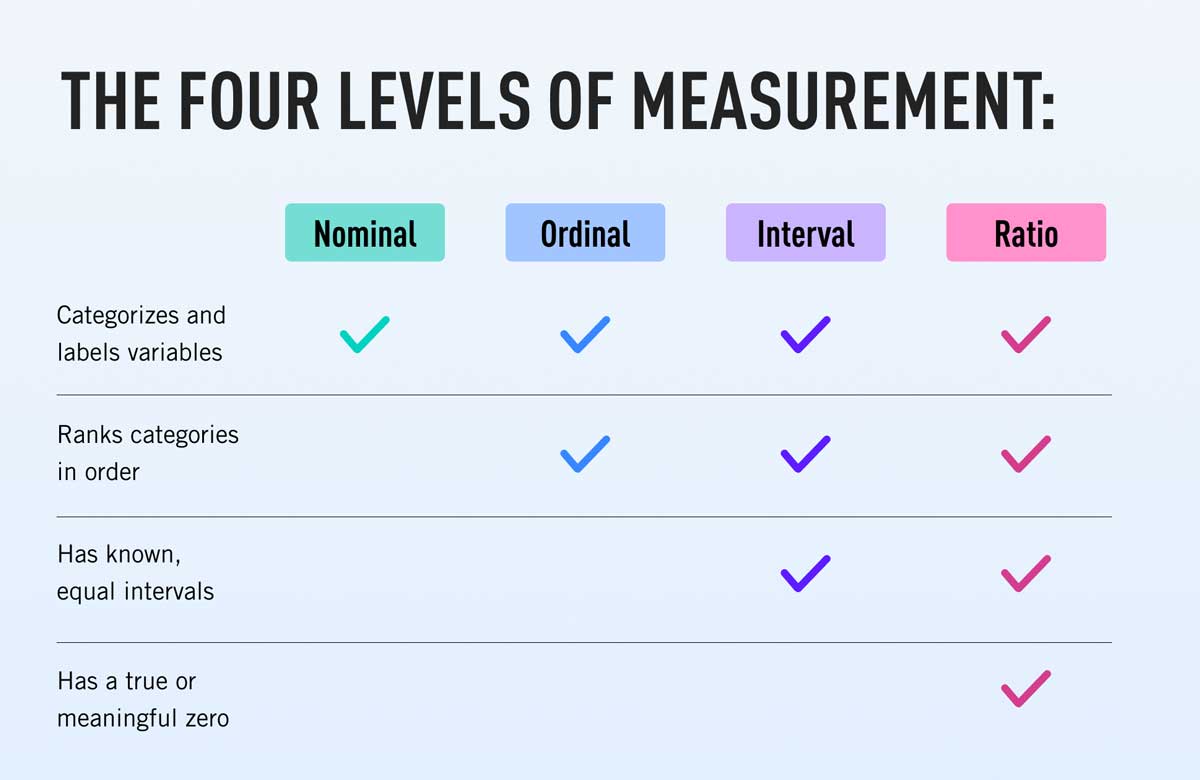
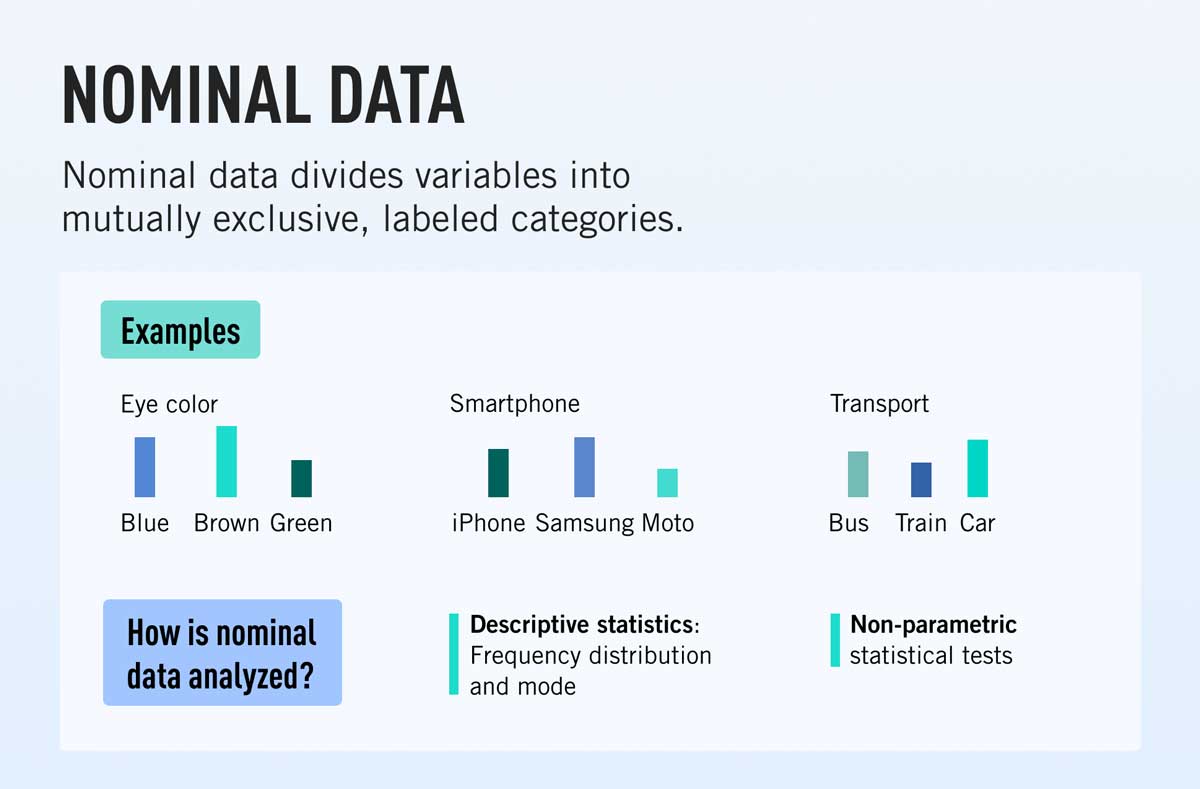
Nominal
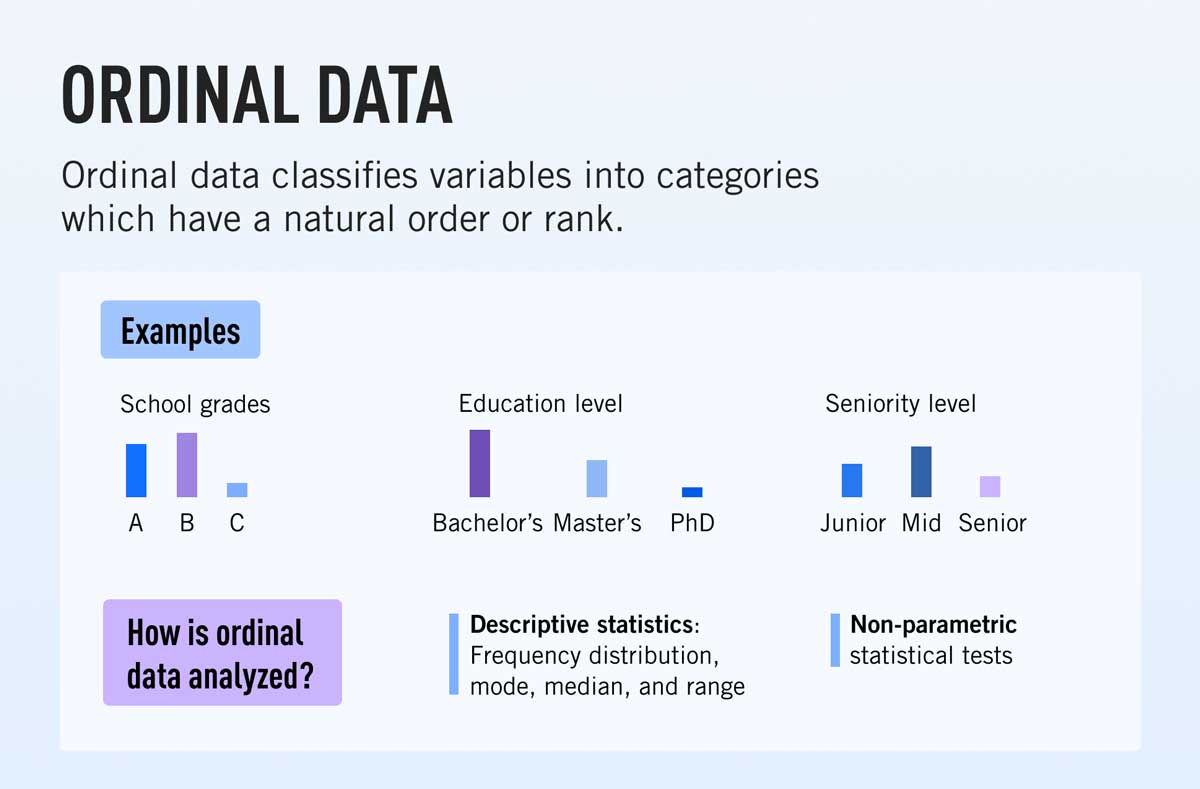
Ordinal
Interval
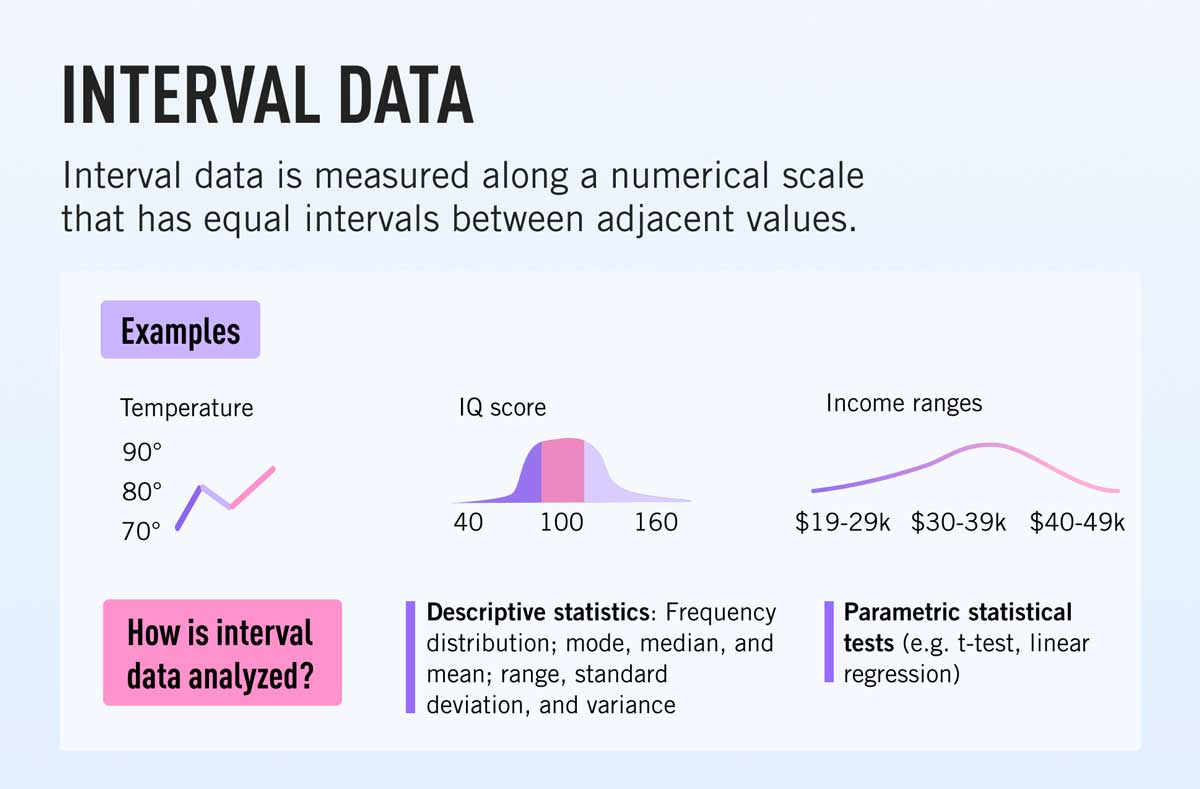
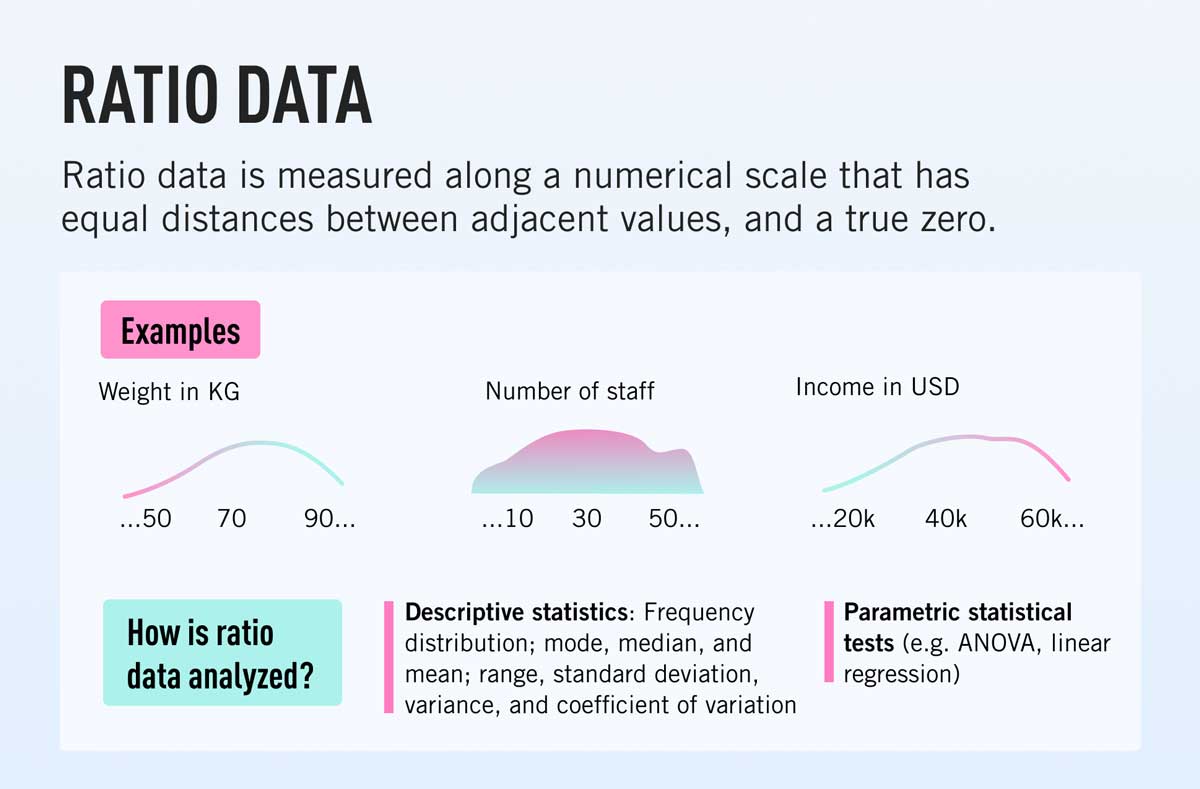
Ratio
Qualitative versus Quantitative
Qualitative versus Quantitative
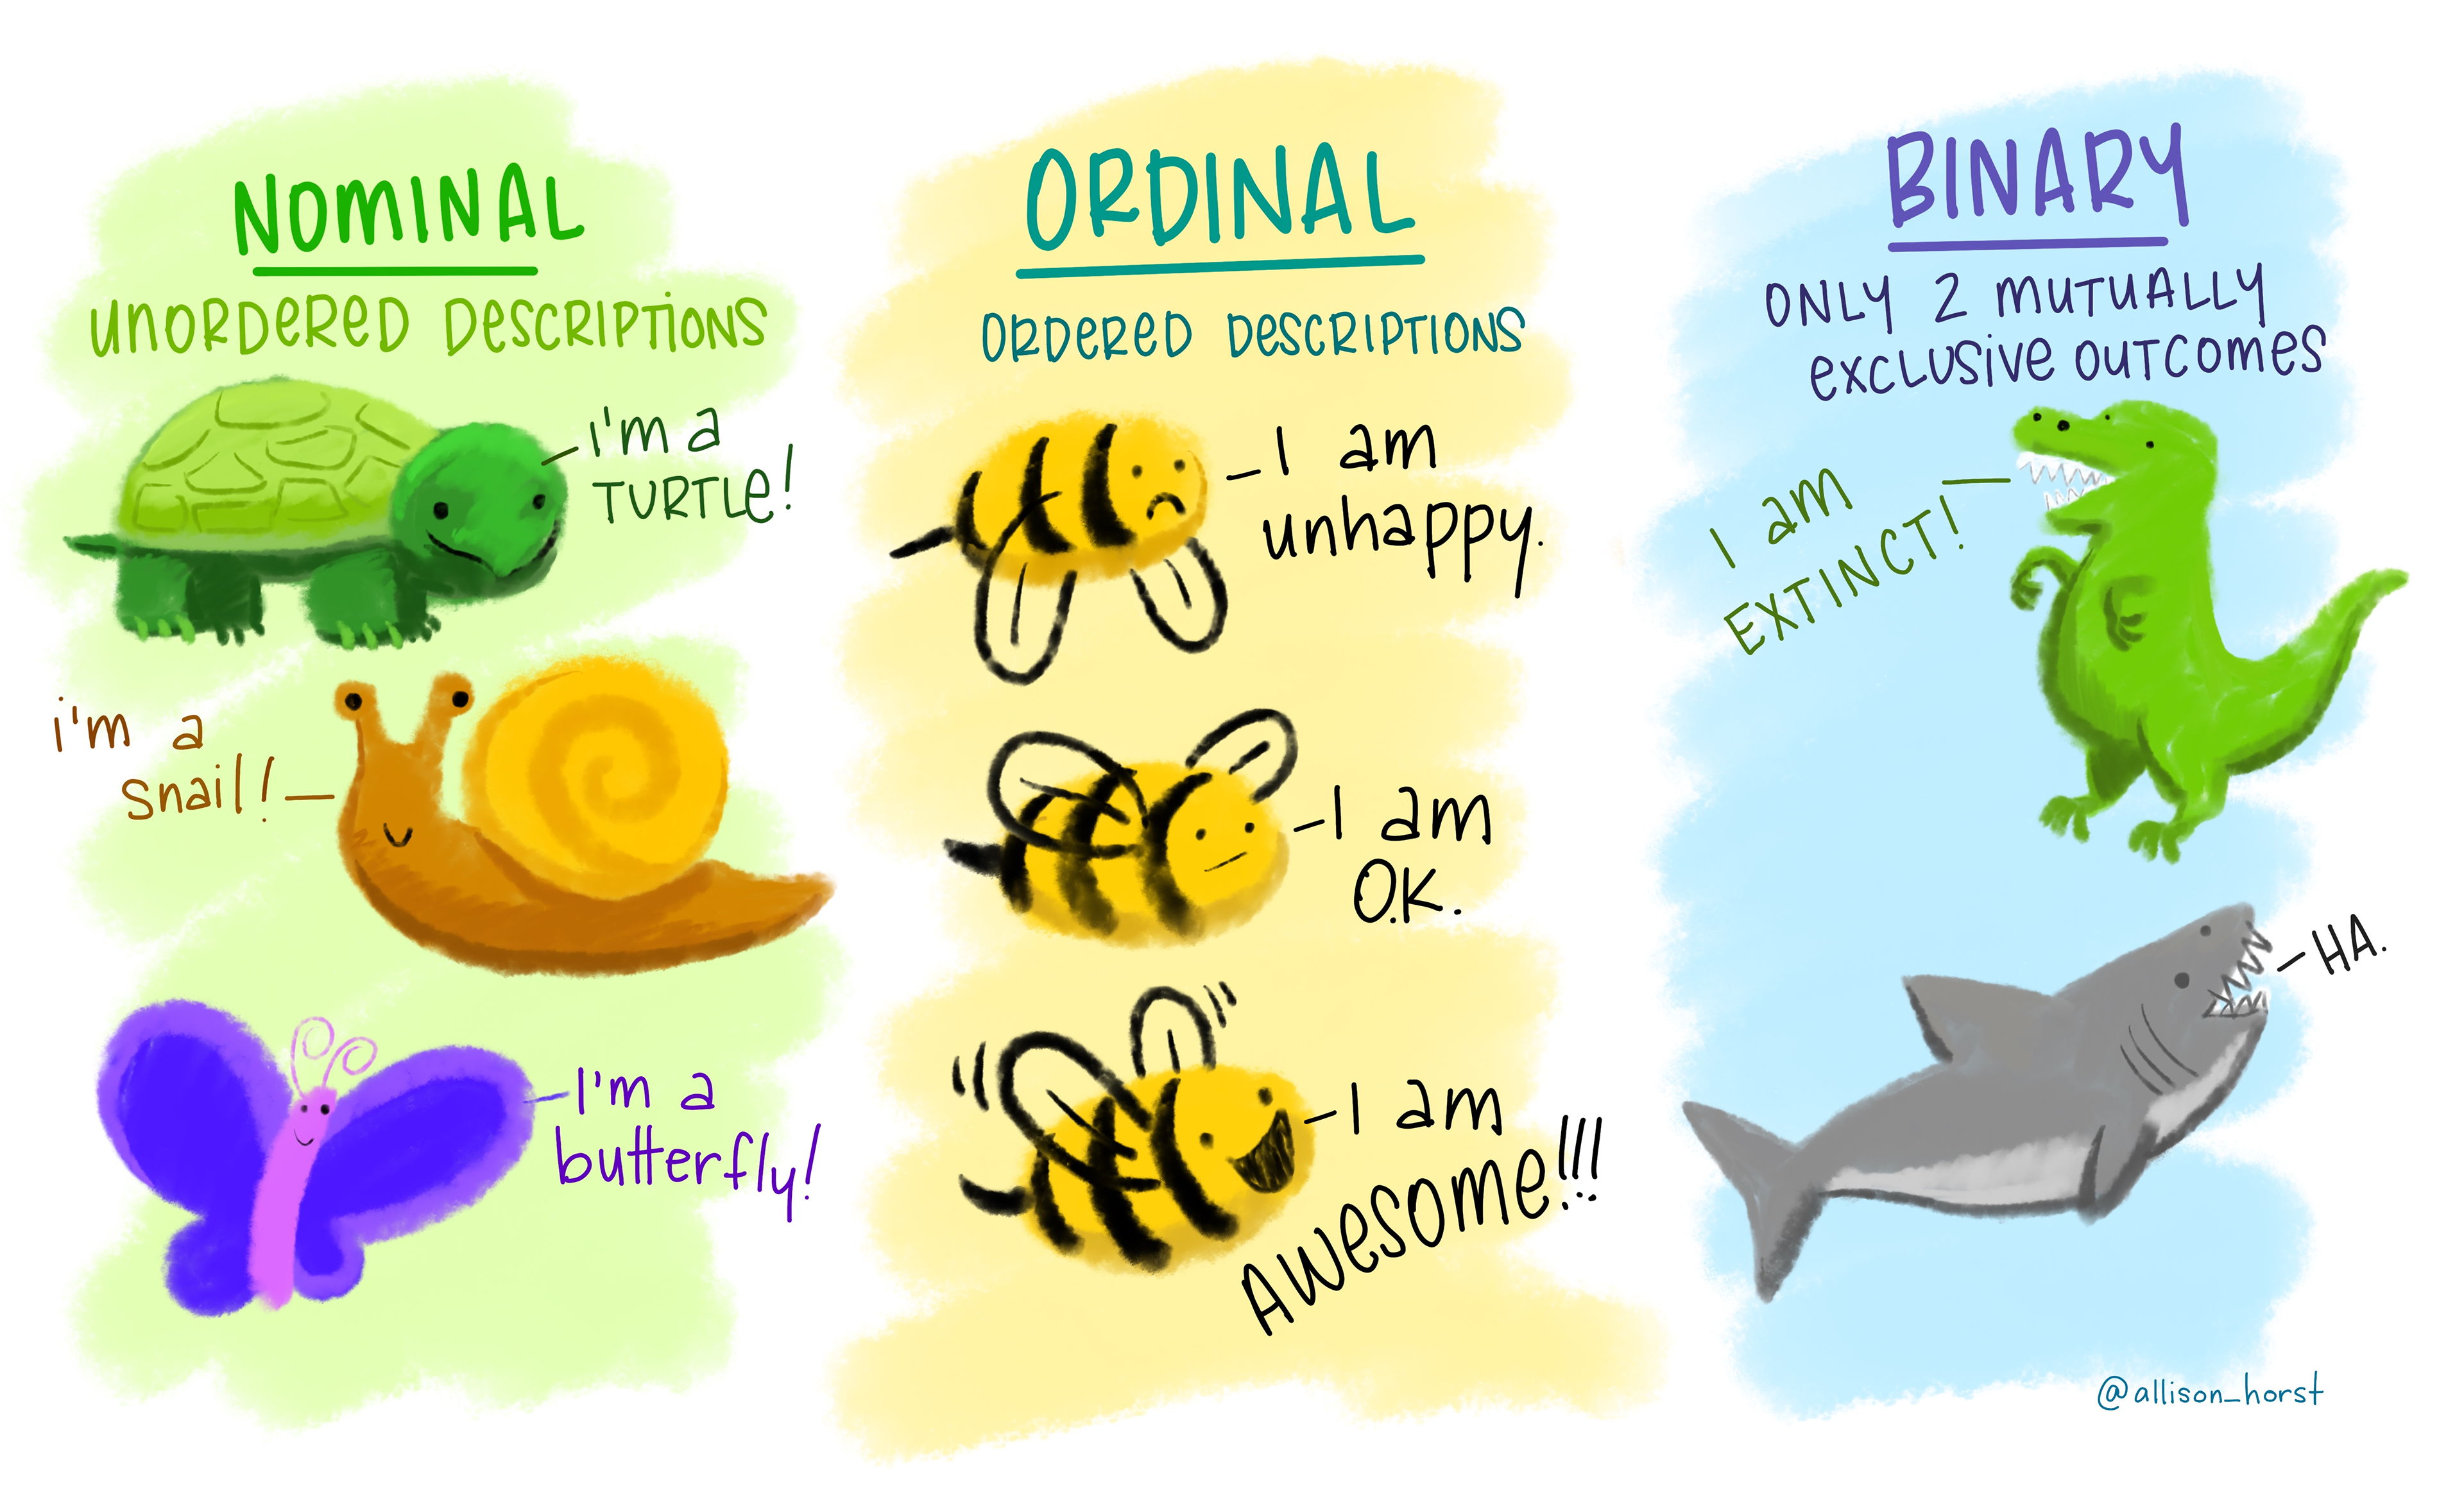
Qualitative measurements
Binary variables are a sub-type of nominal variables.
Qualitative versus Quantitative
Qualitative versus Quantitative
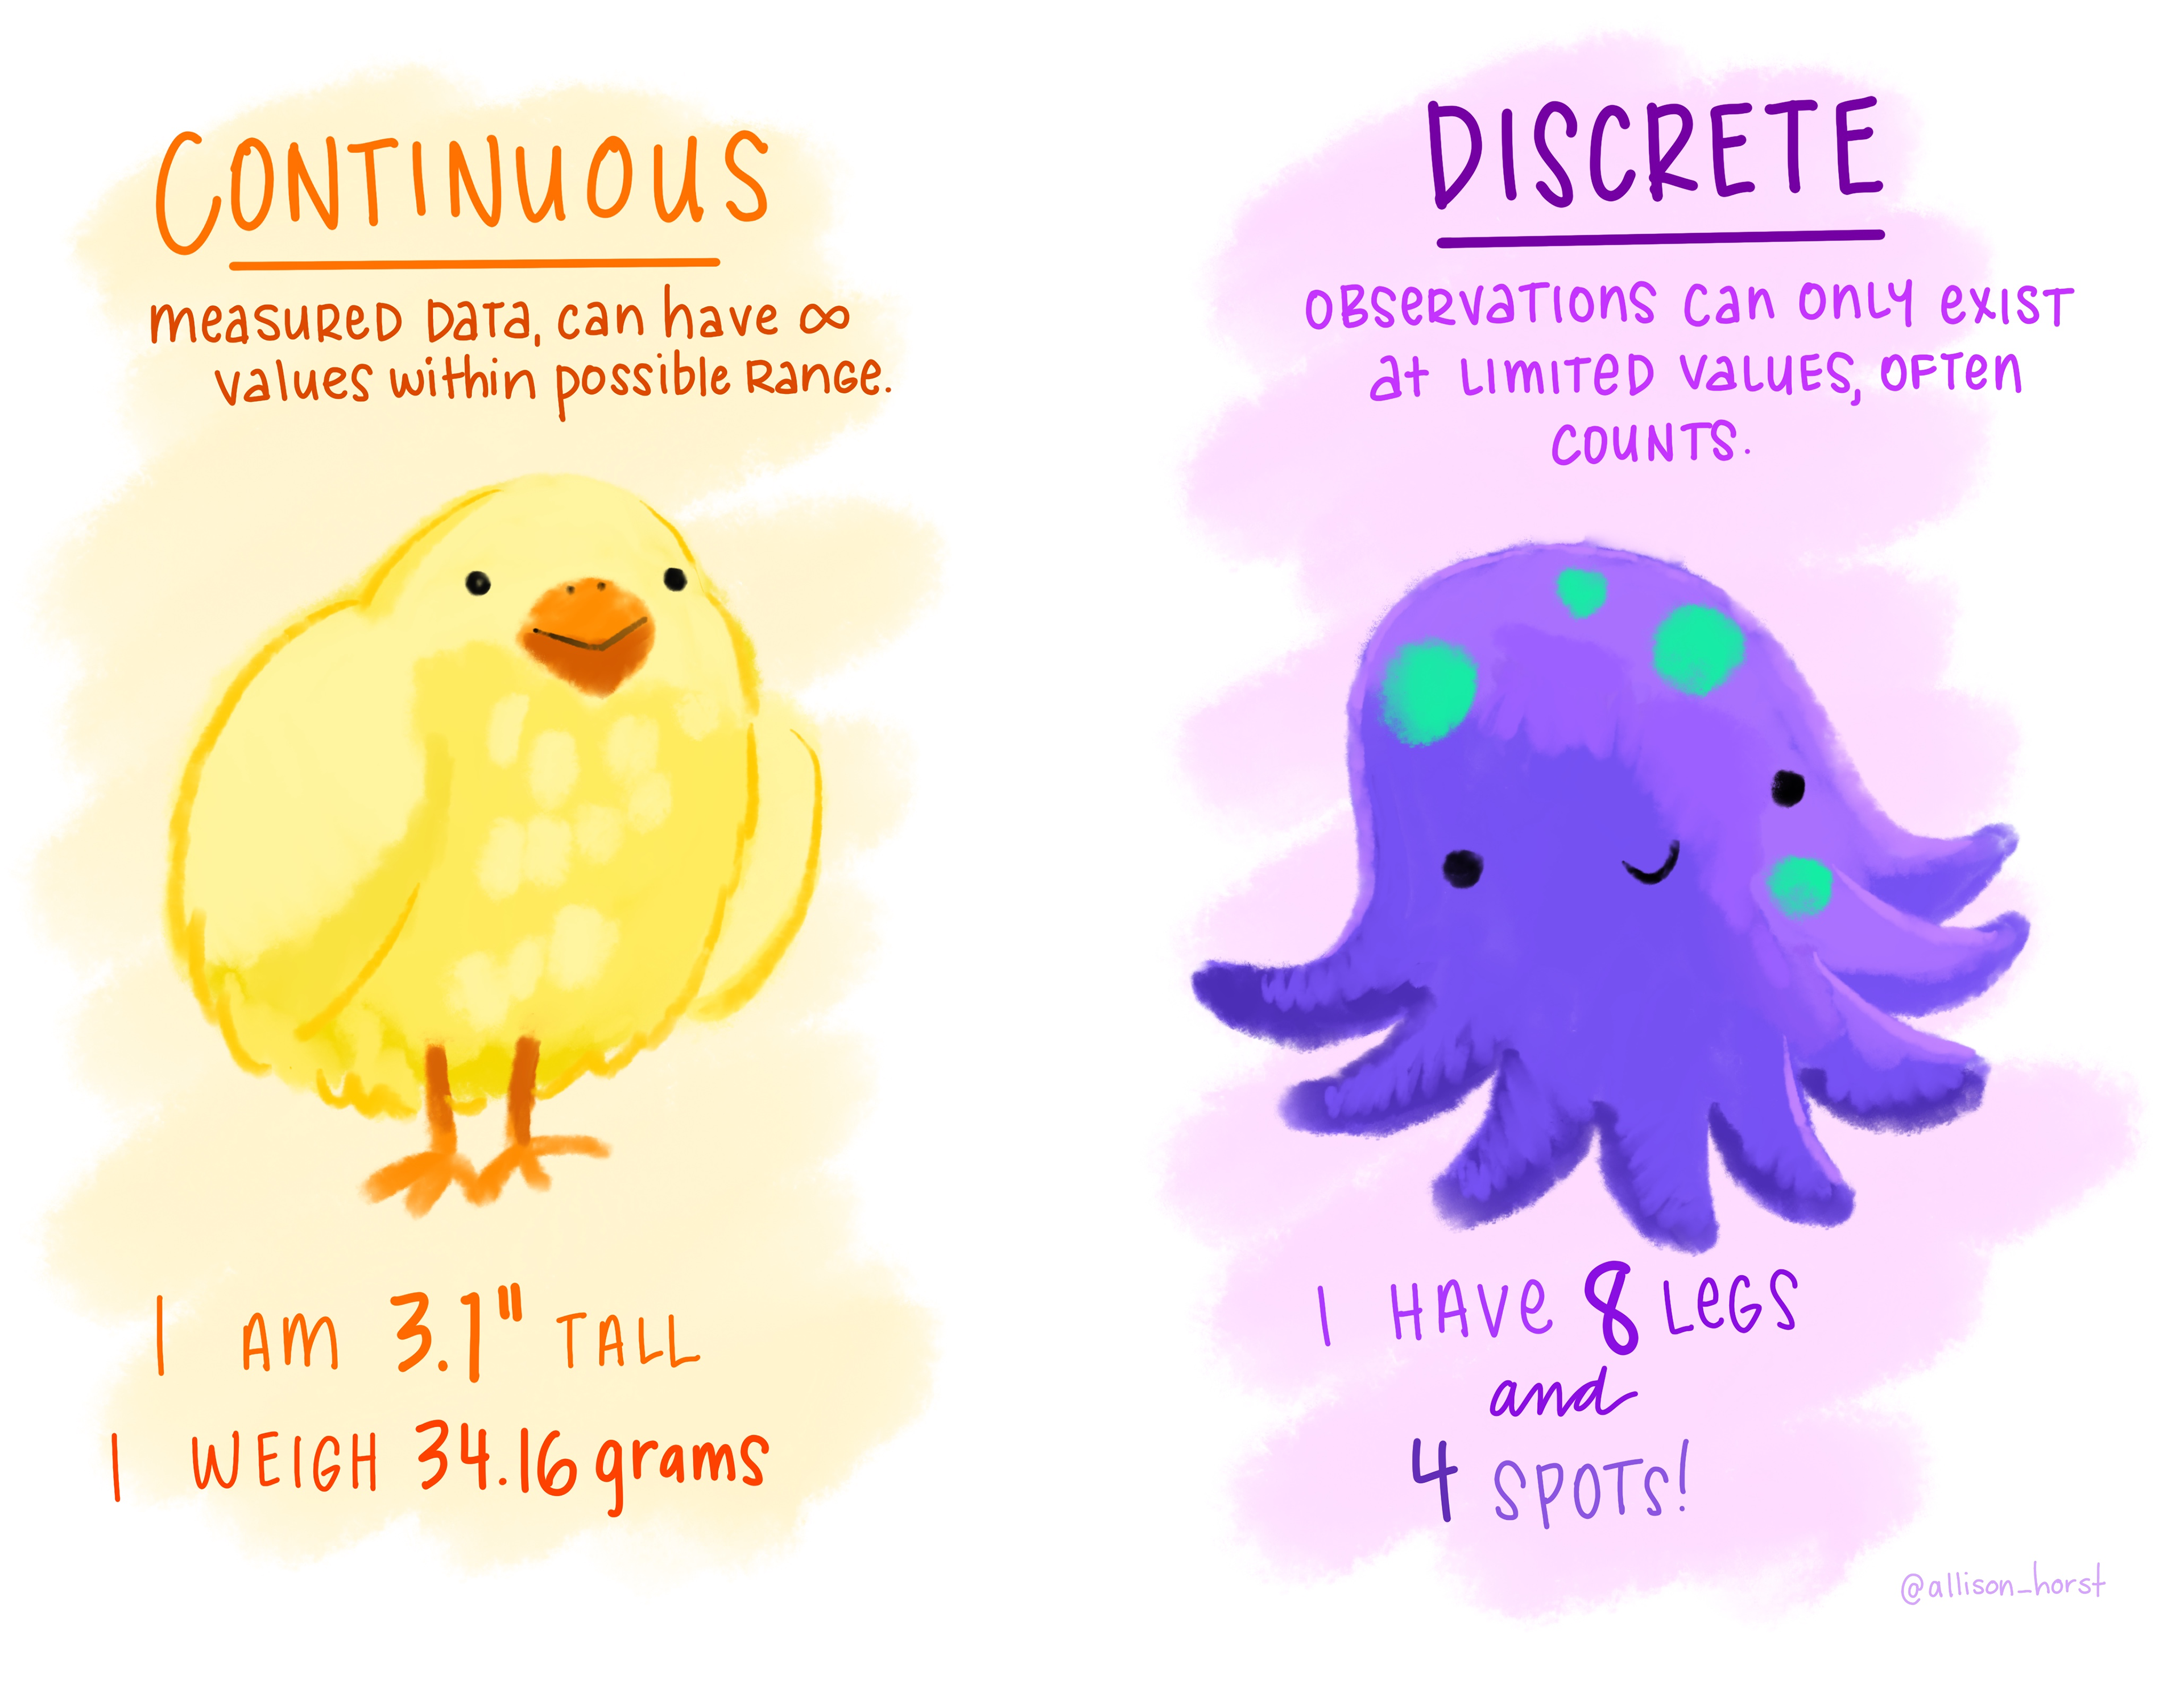
Quantitative measurements
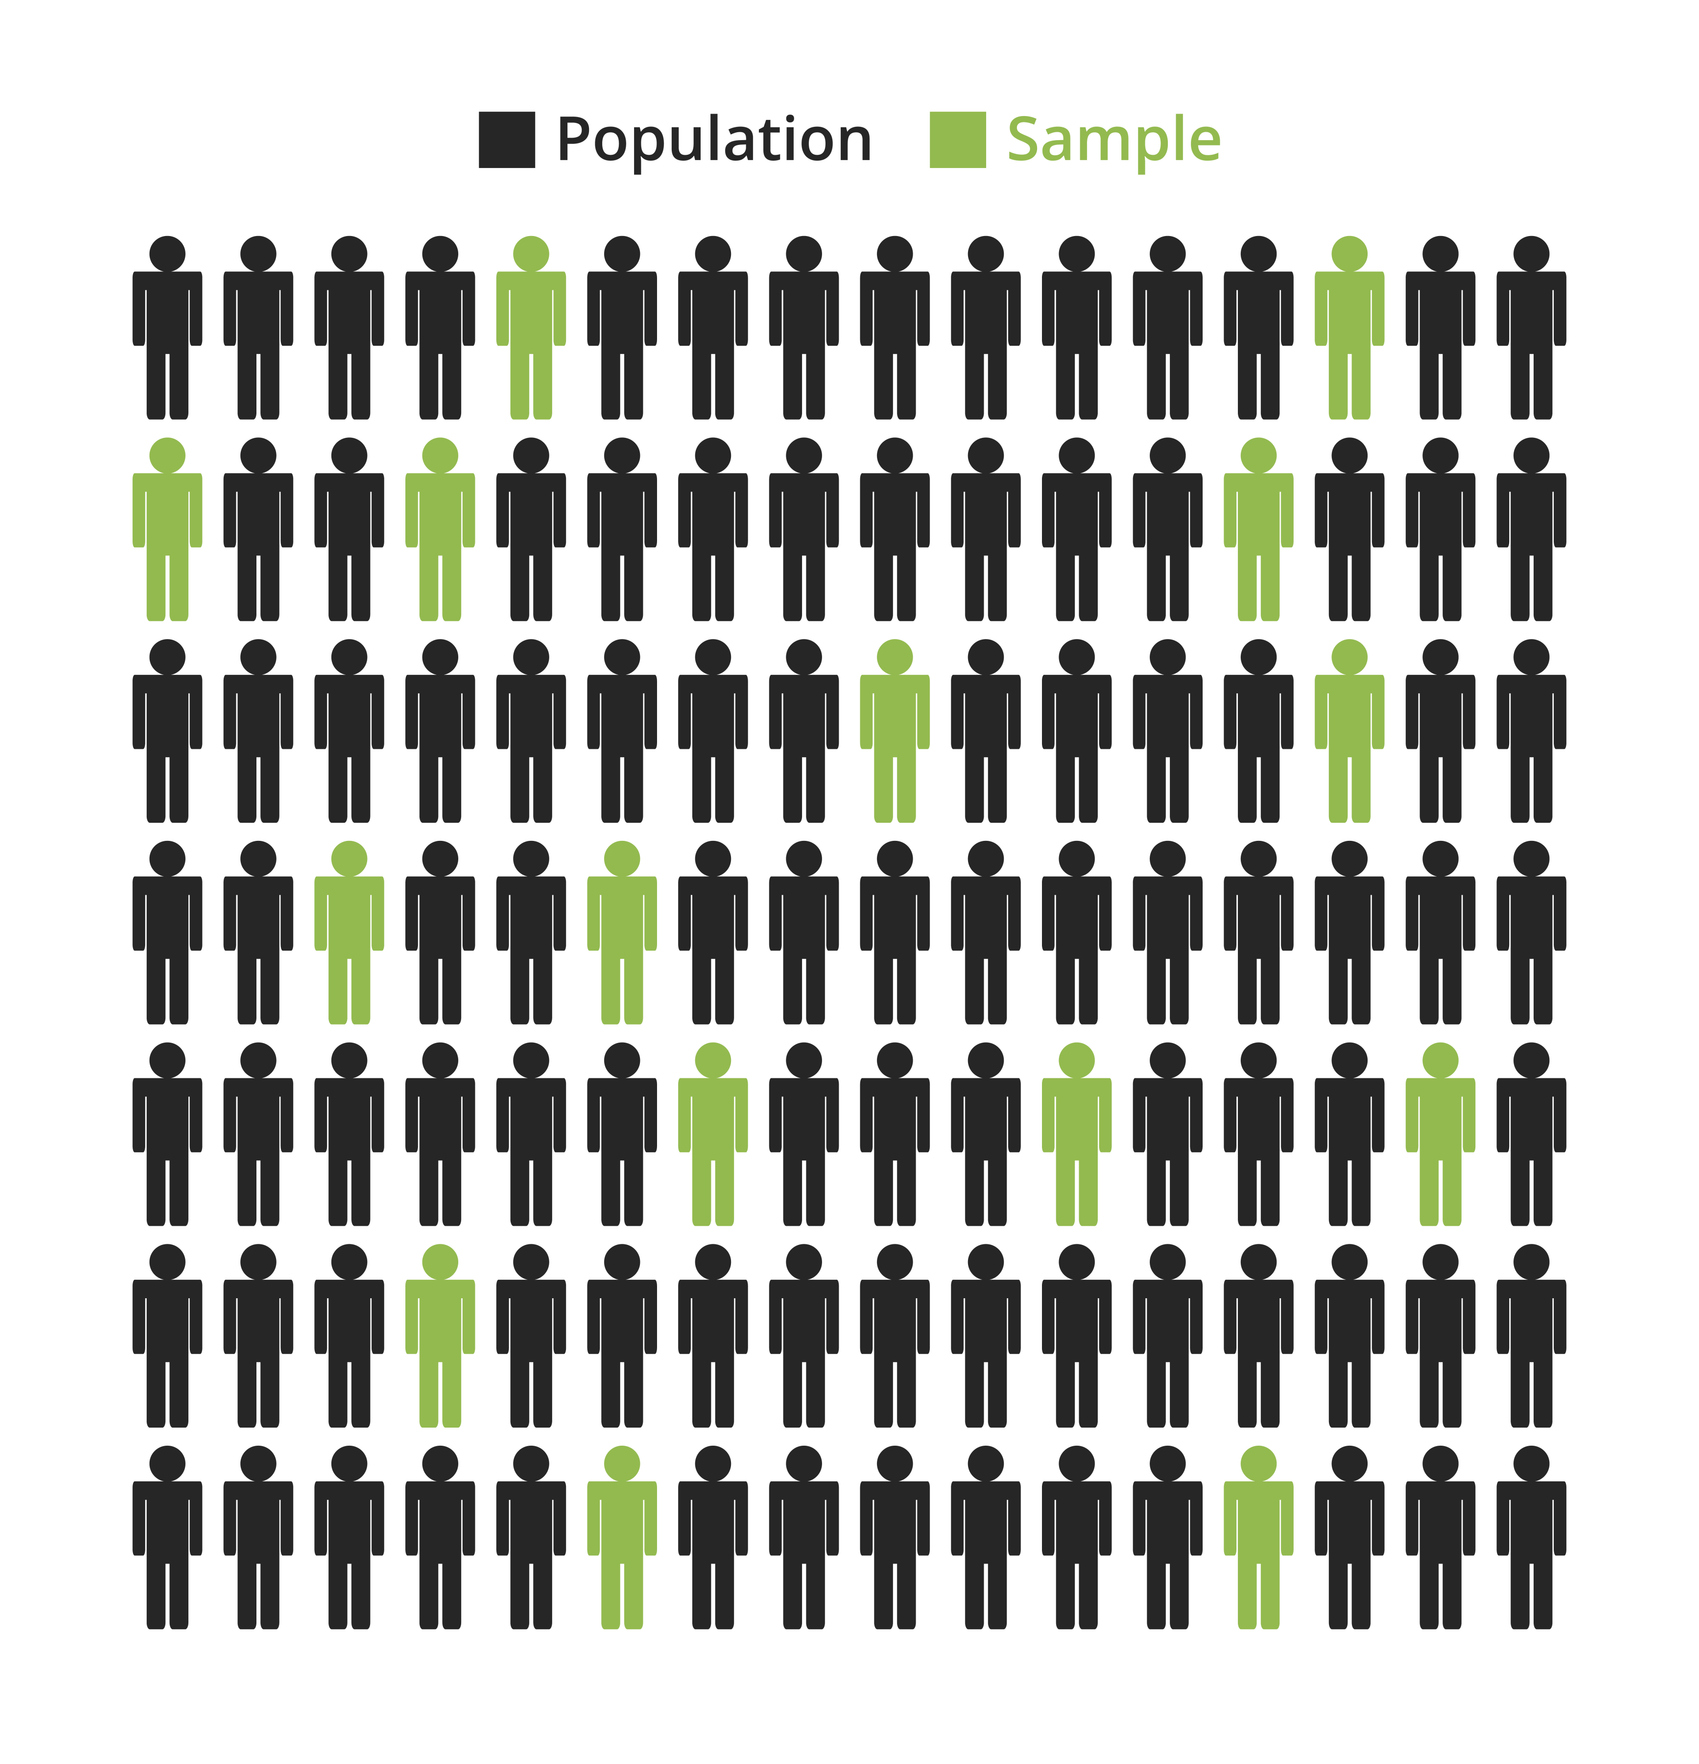
🎲 Simple random sampling
Advantages:
✔ It provides a simple and fair way of selecting the sample
✔ It’s based on randomness so it maximizes the chance of an unbiased / representative sample
Limitations:
✖️ Hard to do because a complete list of the population is usually not available
✖️ Can be very expensive and time consuming
🎲 Systematic sampling
Advantage:
✔ Sometimes it is easier to apply than simple random sampling
Limitation:
✖️ Any patterns present in the population may bias the sample
🎲 Stratified sampling
Advantages:
✔ It is very useful when we want to make sure that minority groups are represented in the sample
✔ Can calculate the probability of an individual case being included
Limitations:
✖ Creating stratified lists of individuals may be expensive
✖ Sometimes the population cannot be divided into different strata
🎲 Cluster sampling
Advantage:
✔ Cheaper and more efficient for geographically dispersed populations
Limitation:
✖️The sample will be biased if the clusters do not represent the population
🙅 🎲 Convenience sampling
Advantage:
✔ Cheap, time-saving, and simple to implement
Limitation:
✖️ Often leads to selection bias and thus study results aren’t generalizable
🙅 🎲 Quota sampling
Advantages:
✔ Cheaper, faster, and easier to implement than stratified sampling
✔ More representative than other non-probability methods
Limitations:
✖ Miss people who are not in that particular area at that particular time
✖ Since it’s not based on random selection, selection bias is still possible and therefore representativeness is not guaranteed
🙅 🎲 Network sampling
also known as
SNOWBALL SAMPLING
Advantage:
✔ Useful when individuals in the population are difficult to identify (e.g. drug users, un-housed folks)
Limitations:
✖️ Selection bias is likely since respondents are more similar to each other than randomly drawn individuals
✖️ Can be slow since it relies on respondents’ referrals
🙅 🎲 Voluntary sampling
Advantage:
✔ Similar to convenience sampling, it’s cheap, time-saving, and simple to implement
Limitation:
✖️ People with strong opinions are more likely to respond to your survey