Selecting the native pipe
The |> is recommended over %>% simply because it’s much simpler to use and it’s always available (%>% relied on the magrittr package which was a dependency of tidyverse packages).
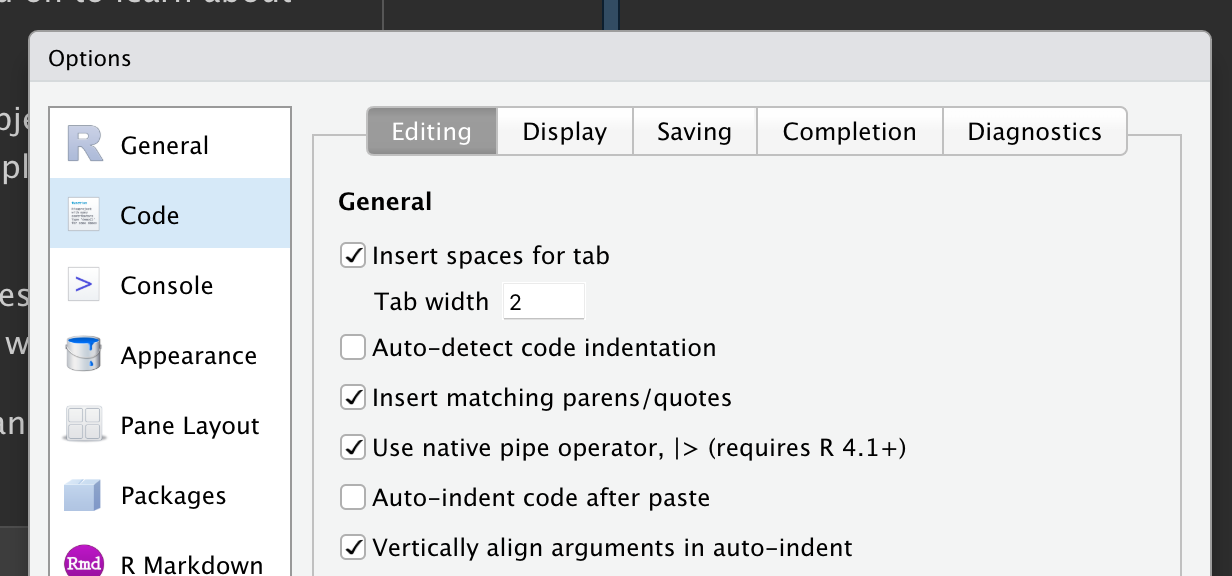
You’ll need to specify to R that you want to enable its usage by going to Tools > Global Options > Code. Within the “Editing” Tab there is an option to “Use native pipe operator, |>”. Check it!
Other Formatting Options
There are some other useful formatting options I’d suggest setting globally and others you can specify to your preferences.
Suggested:
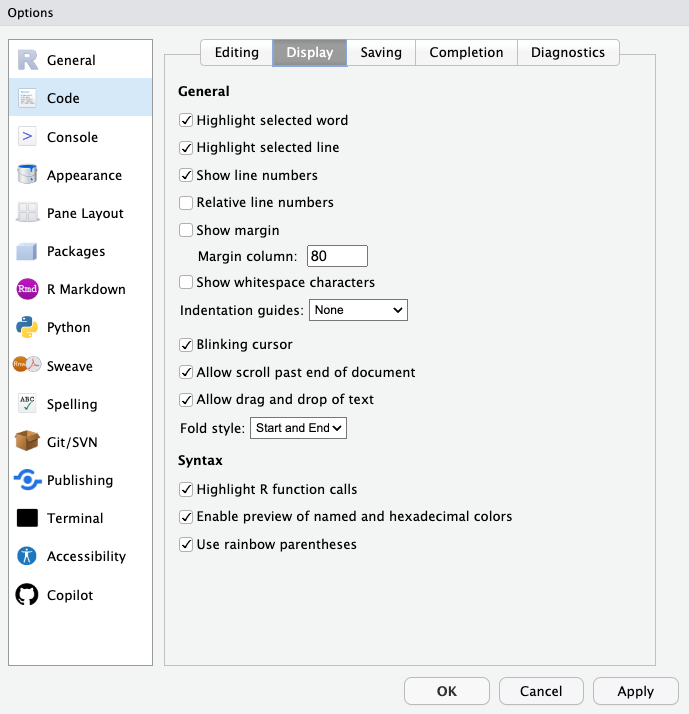
- Highlight Function Calls
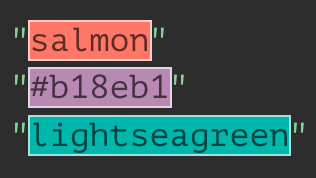
- Enable preview of colors
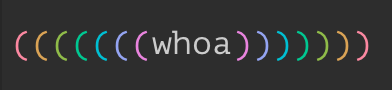
- Rainbow parentheses
Other Formatting Options
There are some other useful formatting options I’d suggest setting globally and others you can specify to your preferences.
Suggested:
- Highlight Function Calls
- Enable preview of colors
- Rainbow parentheses
Other Formatting Options
There are some other useful formatting options I’d suggest setting globally and others you can specify to your preferences.
Suggested:
- Highlight Function Calls
- Enable preview of colors
- Rainbow parentheses
Other Formatting Options
There are some other useful formatting options I’d suggest setting globally and others you can specify to your preferences.
Suggested:
- Highlight Function Calls
- Enable preview of colors
- Rainbow parentheses
Other Formatting Options
There are some other useful formatting options I’d suggest setting globally and others you can specify to your preferences.
Up to you:
- Code highlight style
Other Formatting Options
There are some other useful formatting options I’d suggest setting globally and others you can specify to your preferences.
Up to you:
- Pane layout
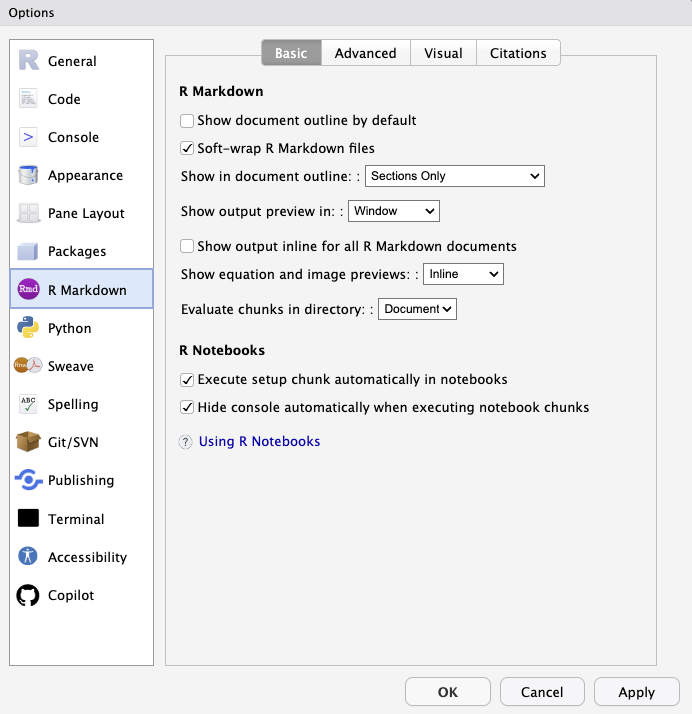
Other Formatting Options
There are some other useful formatting options I’d suggest setting globally and others you can specify to your preferences.
Up to you:
- Markdown options
- Output preview
- Inline output
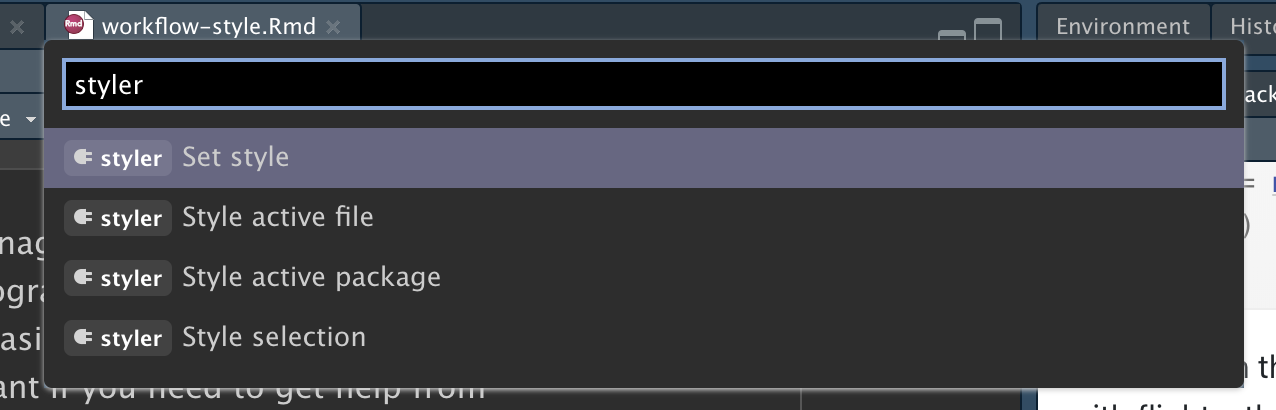
Styling existing code
Imagine you’ve inherited a bunch of code from someone else and NOTHING is styled in the tidyverse way you’ve become accustomed. Or, you’ve dabbled in R before and you have some old code that is all over the place, with respect to styling.
Thanks to Lorenz Walthert there’s a package for that! Using the styler package you can automatically apply the tidyverse style guide standards to various filetypes (.R, .qmd, .Rmd, etc.) or even entire projects.
Have a style or variation of the tidyverse style that you prefer? You can specify that in the package as well. Use the keyboard shortcut Cmd/Ctl + Shift + P and search for “styler” to see all the options available.
Creating an RStudio Project
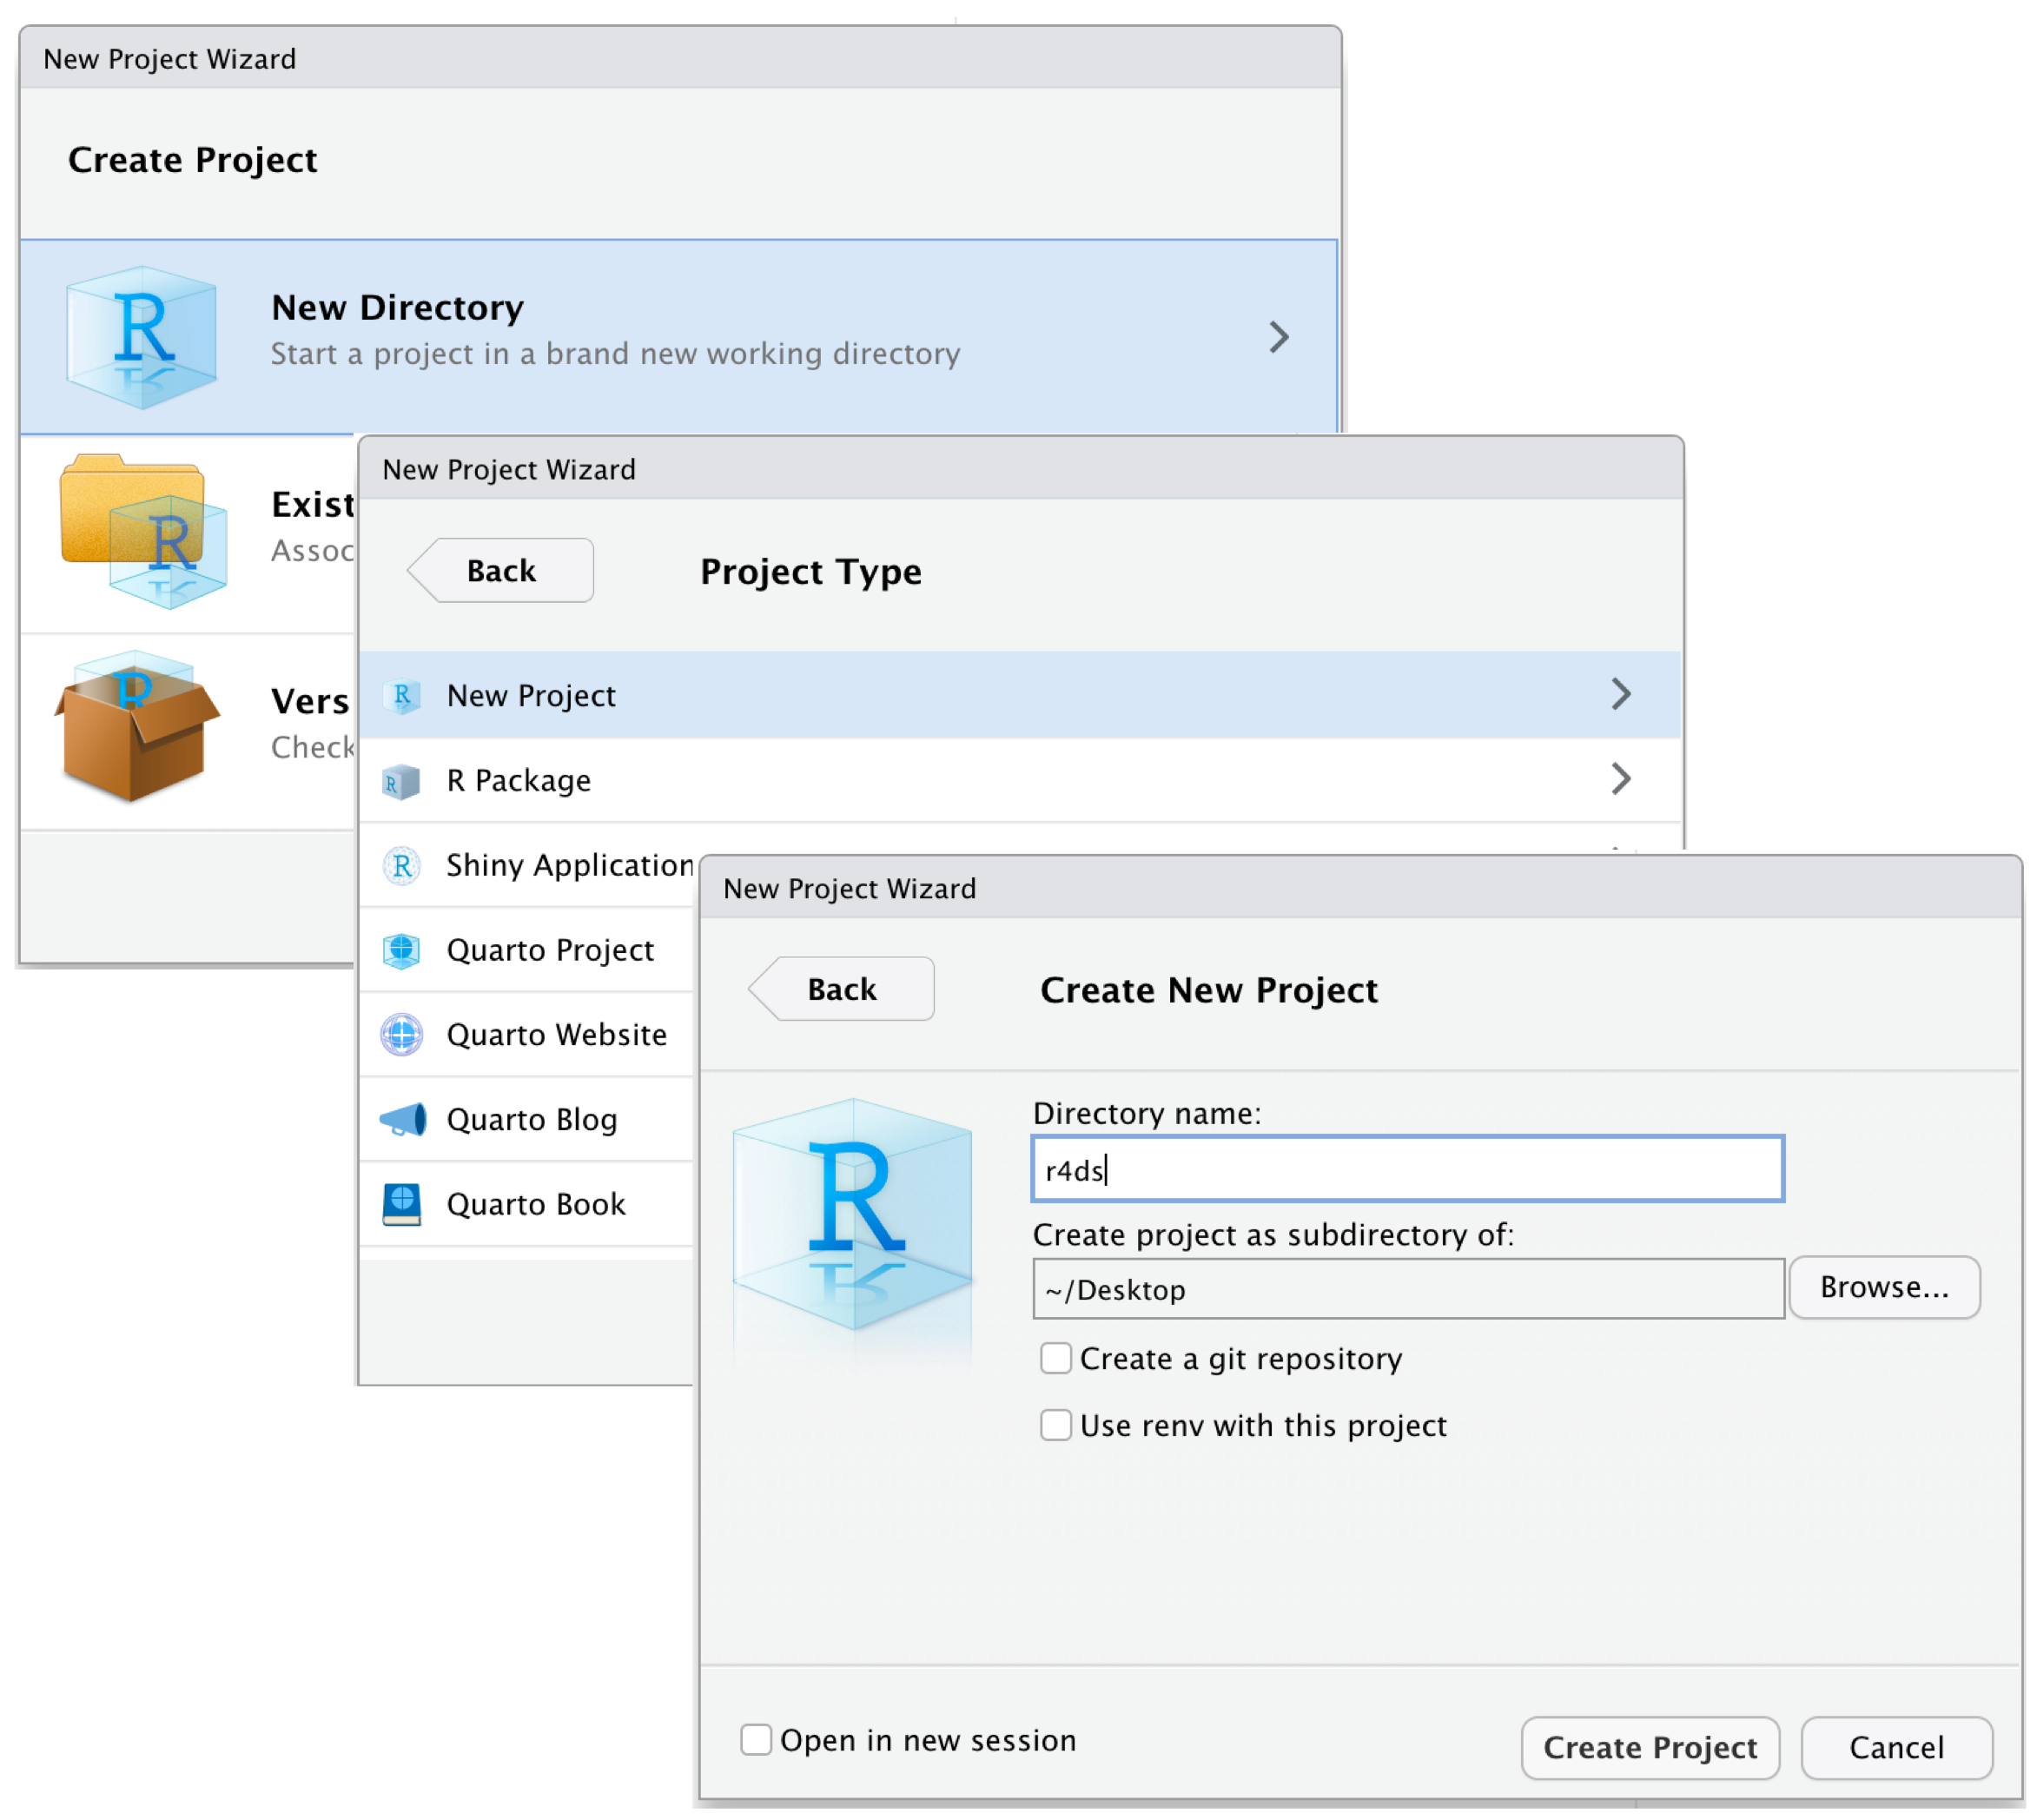
You can create a project by clicking
- File > New Project…
-
![]() in the upper-left corner of RStudio
in the upper-left corner of RStudio - the dropdown menu in the upper-right corner of RStudio and selecting New Project…
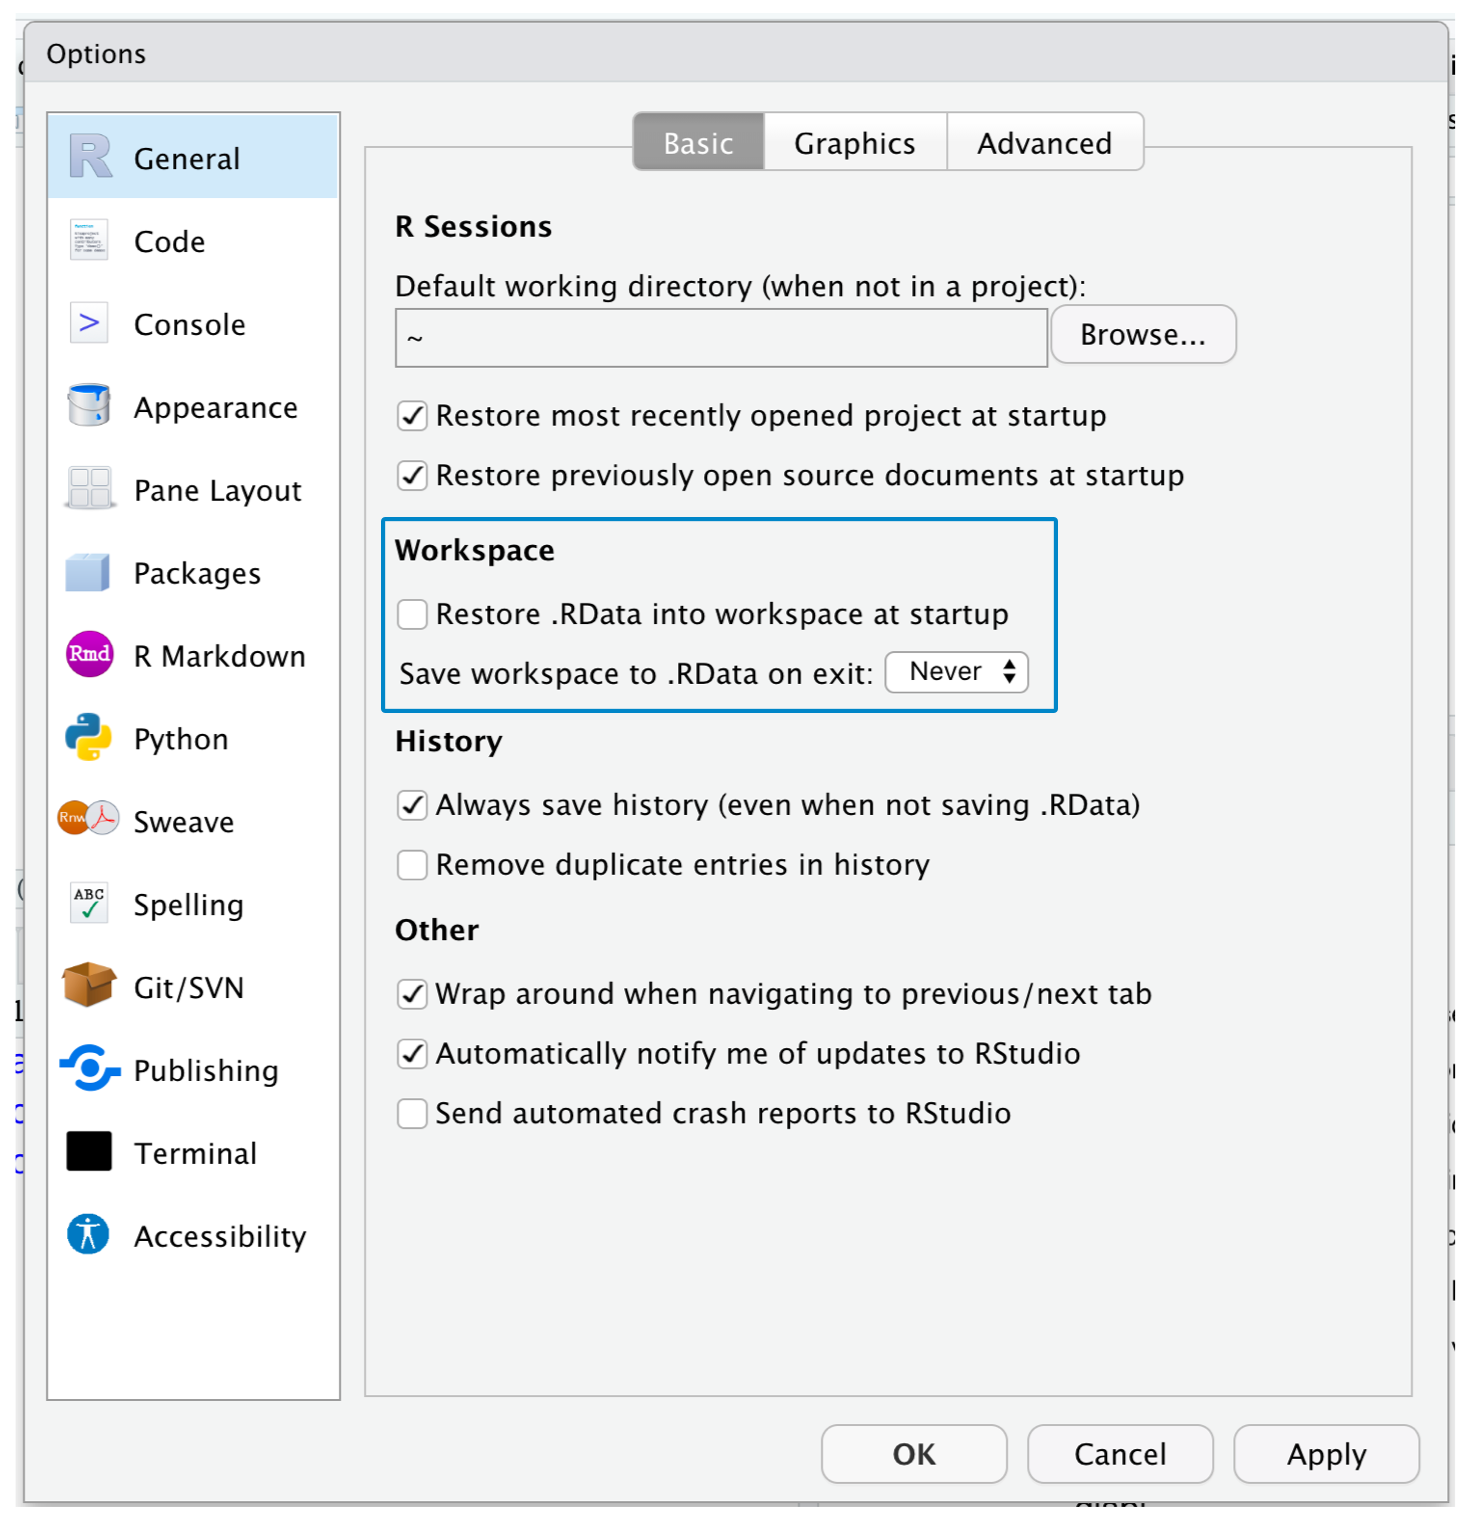
Portability
For research to be reproducible, it must also be portable. Portable software operates independently of workflow.
- Use
setwd(). - Use absolute paths except for fixed, immovable sources (secure data).
read_csv("C:/my_project/data/my_data.csv")
- Use
install.packages()inRscript or .qmd files. - Use
rm(list=ls())anywhere but your console.
- Use RStudio projects (or the
herepackage) to set directories. - Use relative paths to load and save files:
read_csv("./data/my_data.csv")
- Load all required packages using
library(). - Clear your workspace when closing RStudio.
- Set Tools > Global Options… > Save workspace… to Never
Example Pipeline
Every stage (oval) has an unambiguous input and output. Everything that precedes a given stage is a dependency — something required to run it.

Solution: 1. Adjust settings
Clear .RData, Never save
Solution: 1. Adjust settings
Native pipe
Solution: 1. Adjust settings
Highlight function calls; preview colors; rainbow parentheses
Solution: 1. Adjust settings
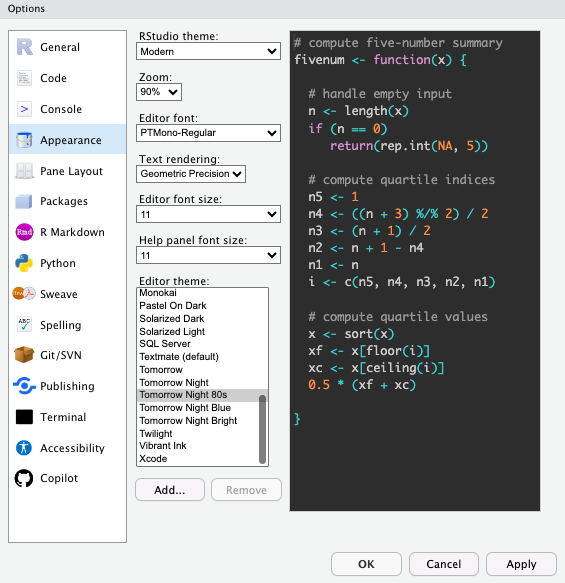
Code appearance
Solution: 1. Adjust settings
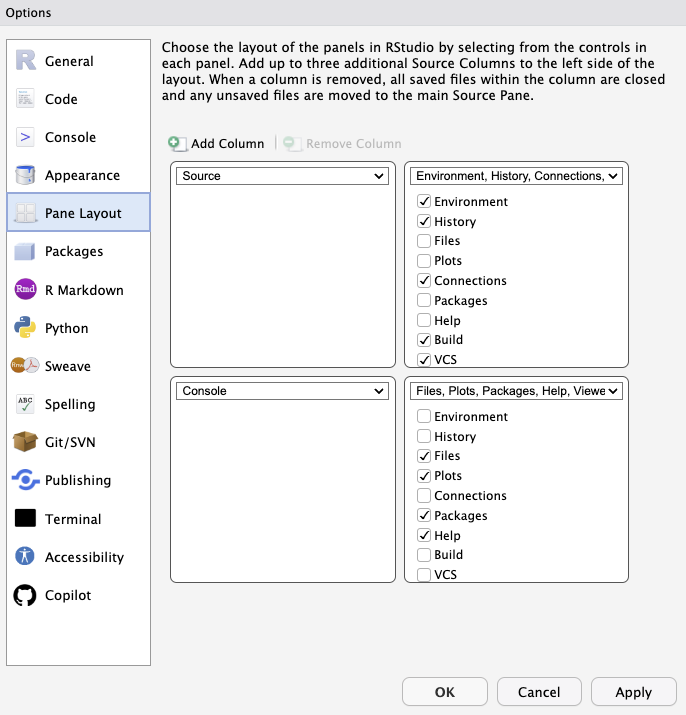
Pane Layout
Solution: 1. Adjust settings
Markdown Preferences
Solution: 3. Option + Shift + K / Alt + Shift + K